Confusion Matrix Calculator
ML classification metrics & evaluation • 2026 edition
Confusion Matrix Formulas:
Show Calculator\( \text{Accuracy} = \frac{TP + TN}{TP + TN + FP + FN} \)
\( \text{Precision} = \frac{TP}{TP + FP} \)
\( \text{Recall} = \frac{TP}{TP + FN} \)
\( \text{F1-Score} = 2 \times \frac{\text{Precision} \times \text{Recall}}{\text{Precision} + \text{Recall}} \)
\( \text{Specificity} = \frac{TN}{TN + FP} \)
Where:
- \( TP \) = True Positives (correctly predicted positive)
- \( TN \) = True Negatives (correctly predicted negative)
- \( FP \) = False Positives (incorrectly predicted positive)
- \( FN \) = False Negatives (incorrectly predicted negative)
Additional metrics:
- Matthews Correlation Coefficient: \( \frac{TP \times TN - FP \times FN}{\sqrt{(TP+FP)(TP+FN)(TN+FP)(TN+FN)}} \)
- Jaccard Index: \( \frac{TP}{TP + FP + FN} \)
- FPR (False Positive Rate): \( \frac{FP}{FP + TN} \)
- FNR (False Negative Rate): \( \frac{FN}{FN + TP} \)
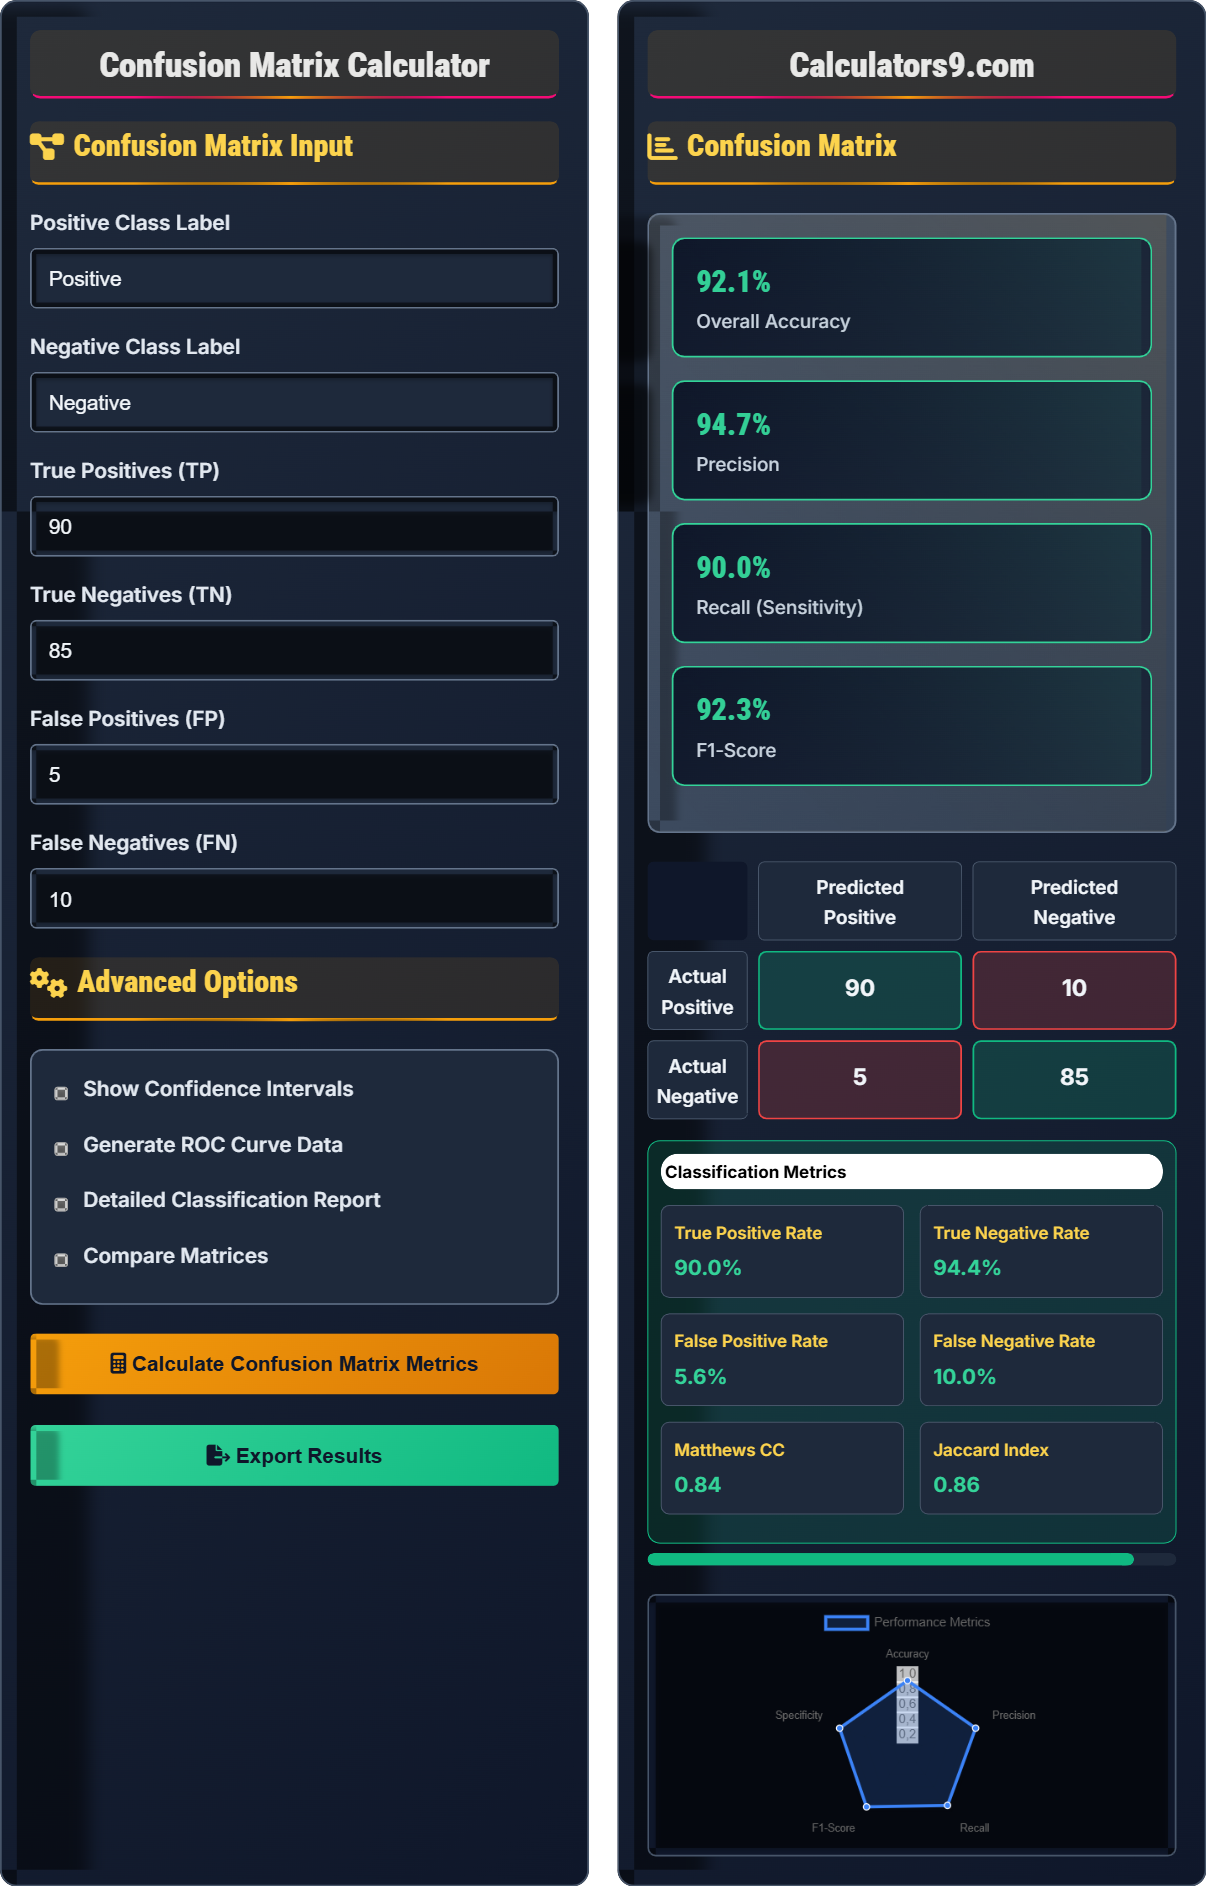
Example: For a binary classifier with 90 TP, 85 TN, 5 FP, and 10 FN:
\( \text{Accuracy} = \frac{90 + 85}{90 + 85 + 5 + 10} = \frac{175}{190} = 0.921 \) or 92.1%
\( \text{Precision} = \frac{90}{90 + 5} = \frac{90}{95} = 0.947 \) or 94.7%
\( \text{Recall} = \frac{90}{90 + 10} = \frac{90}{100} = 0.900 \) or 90.0%
The model has an accuracy of 92.1%, precision of 94.7%, and recall of 90.0%.
Confusion Matrix Input
Advanced Options
Confusion Matrix
Positive
Negative
Positive
Negative
| Metric | Value | Quality |
|---|---|---|
| Accuracy | 92.1% | Excellent |
| Precision | 94.7% | Excellent |
| Recall | 90.0% | Good |
| F1-Score | 92.3% | Excellent |
Comprehensive Confusion Matrix Guide
A confusion matrix is a table used to describe the performance of a classification model on a set of test data for which the true values are known. It provides a detailed breakdown of correct and incorrect predictions, organized by class. The matrix allows for detailed analysis of classification performance beyond simple accuracy metrics.
The confusion matrix for binary classification:
Where:
- True Positives (TP): Cases correctly predicted as positive
- True Negatives (TN): Cases correctly predicted as negative
- False Positives (FP): Cases incorrectly predicted as positive (Type I error)
- False Negatives (FN): Cases incorrectly predicted as negative (Type II error)
Choose metrics based on your problem requirements:
- Accuracy: Balanced datasets where all errors are equally important
- Precision: When false positives are costly (e.g., spam detection)
- Recall: When false negatives are costly (e.g., disease detection)
- F1-Score: When you need to balance precision and recall
- Specificity: When false positives are particularly concerning
- Excellent: Values > 0.90
- Good: Values 0.80-0.90
- Fair: Values 0.70-0.80
- Poor: Values < 0.70
- Context Matters: Domain-specific thresholds may apply
Evaluation Fundamentals
Table showing true vs predicted classifications.
\( \text{Accuracy} = \frac{TP + TN}{TP + TN + FP + FN} \)
\( \text{Precision} = \frac{TP}{TP + FP} \)
\( \text{Recall} = \frac{TP}{TP + FN} \)
\( \text{F1-Score} = 2 \times \frac{\text{Precision} \times \text{Recall}}{\text{Precision} + \text{Recall}} \)
- Always consider multiple metrics
- Context determines metric importance
- Imbalanced data requires careful metric selection
Model Development
Systematic approach to assessing model effectiveness and reliability.
- Prepare test dataset
- Generate predictions
- Create confusion matrix
- Calculate metrics
- Interpret results
- Class distribution
- Cost of errors
- Domain requirements
- Statistical significance
Confusion Matrix Learning Quiz
What does a False Positive (FP) represent in a confusion matrix?
The answer is B) A case that was incorrectly predicted as positive. A False Positive occurs when the model predicts the positive class, but the actual class is negative. This is also known as a Type I error. For example, in medical testing, a False Positive would be diagnosing someone as having a disease when they are actually healthy.
Students must understand that the "false" in False Positive refers to the prediction being incorrect, not the actual class. The "positive" refers to the predicted class. So a False Positive is a negative case (healthy person) that was predicted as positive (predicted as diseased). This terminology can be confusing initially, but remembering "predicted vs actual" helps clarify the meaning.
False Positive (FP): Predicted positive but actually negative
Type I Error: Rejecting a true null hypothesis
Actual vs Predicted: True class vs model prediction
• "False" refers to prediction correctness
• "Positive/Negative" refers to predicted class
• Always consider both predicted and actual classes
• Remember: Predicted vs Actual
• FP = Predicted Positive, Actually Negative
• Think of medical testing examples
• Confusing predicted vs actual class
• Thinking "false" refers to actual class
• Mixing up False Positive and False Negative
Given a binary classifier with 80 TP, 70 TN, 15 FP, and 5 FN, calculate the accuracy, precision, and recall. Show your work.
Given: TP=80, TN=70, FP=15, FN=5
Accuracy calculation:
\( \text{Accuracy} = \frac{TP + TN}{TP + TN + FP + FN} = \frac{80 + 70}{80 + 70 + 15 + 5} = \frac{150}{170} = 0.882 \) or 88.2%
Precision calculation:
\( \text{Precision} = \frac{TP}{TP + FP} = \frac{80}{80 + 15} = \frac{80}{95} = 0.842 \) or 84.2%
Recall calculation:
\( \text{Recall} = \frac{TP}{TP + FN} = \frac{80}{80 + 5} = \frac{80}{85} = 0.941 \) or 94.1%
The model has an accuracy of 88.2%, precision of 84.2%, and recall of 94.1%.
This calculation demonstrates how different metrics can vary for the same model. The recall (94.1%) is higher than precision (84.2%), indicating the model is better at identifying positive cases than avoiding false positives. This pattern is common in models that are optimized for sensitivity rather than specificity.
Accuracy: Overall correctness of predictions
Precision: Proportion of positive predictions that are correct
Recall: Proportion of actual positives correctly identified
• Always use the correct formula for each metric
• Convert fractions to percentages for better interpretation
• Round to appropriate decimal places
• Remember: Precision = TP/(TP+FP)
• Recall = TP/(TP+FN)
• Accuracy = (TP+TN)/(TP+TN+FP+FN)
• Confusing precision and recall formulas
• Forgetting to include all components in accuracy
• Arithmetic errors in the calculations
A medical diagnostic test for a rare disease has the following confusion matrix: TP=95, TN=980, FP=15, FN=5. Calculate the sensitivity (recall) and specificity. If the disease affects 1% of the population, discuss the practical implications of these metrics for the test.
Given: TP=95, TN=980, FP=15, FN=5
Sensitivity (Recall) calculation:
\( \text{Sensitivity} = \frac{TP}{TP + FN} = \frac{95}{95 + 5} = \frac{95}{100} = 0.95 \) or 95%
Specificity calculation:
\( \text{Specificity} = \frac{TN}{TN + FP} = \frac{980}{980 + 15} = \frac{980}{995} = 0.985 \) or 98.5%
Practical implications:
- The test has excellent sensitivity (95%) - it correctly identifies 95% of people who have the disease
- The test has excellent specificity (98.5%) - it correctly identifies 98.5% of people who don't have the disease
- However, with a 1% prevalence rate, the positive predictive value (precision) would be: \( \frac{95}{95 + 15} = 86.4\% \)
- This means that 13.6% of positive test results are false positives, which could lead to unnecessary treatment or anxiety
Despite high sensitivity and specificity, the low prevalence means that a significant portion of positive results are false positives.
This example demonstrates the importance of considering prevalence rates in addition to sensitivity and specificity. Even with excellent sensitivity and specificity, low prevalence can lead to a high false positive rate. This is why screening tests often have follow-up confirmatory tests to reduce the impact of false positives in low-prevalence populations.
Sensitivity: Proportion of actual positives correctly identified
Specificity: Proportion of actual negatives correctly identified
Prevalence: Proportion of population with condition
• Consider prevalence when interpreting positive results
• High sensitivity is important for screening tests
• High specificity reduces false positives
• Calculate positive predictive value for low prevalence
• Consider both sensitivity and specificity
• Think about practical implications of errors
• Not considering prevalence in interpretation
• Focusing only on sensitivity or specificity
• Ignoring the impact of false positives
An email service has developed a spam filter with the following confusion matrix: TP=950, TN=8950, FP=50, FN=50. Calculate precision, recall, and F1-score. If the cost of blocking an important email is 10 times the cost of letting spam through, which metric should the engineers prioritize to optimize?
Given: TP=950, TN=8950, FP=50, FN=50
Precision calculation:
\( \text{Precision} = \frac{TP}{TP + FP} = \frac{950}{950 + 50} = \frac{950}{1000} = 0.95 \) or 95%
Recall calculation:
\( \text{Recall} = \frac{TP}{TP + FN} = \frac{950}{950 + 50} = \frac{950}{1000} = 0.95 \) or 95%
F1-Score calculation:
\( \text{F1-Score} = 2 \times \frac{\text{Precision} \times \text{Recall}}{\text{Precision} + \text{Recall}} = 2 \times \frac{0.95 \times 0.95}{0.95 + 0.95} = \frac{1.805}{1.9} = 0.95 \) or 95%
Analysis:
- False Positives (FP): 50 legitimate emails incorrectly marked as spam
- False Negatives (FN): 50 spam emails incorrectly classified as legitimate
- Since blocking an important email costs 10x more than letting spam through, the cost is: 50 × $10 = $500 vs 50 × $1 = $50
- The cost of false positives ($500) is 10 times higher than false negatives ($50)
Engineers should prioritize precision to minimize false positives (blocking important emails). In this case, they should tune the model to reduce FP even if it slightly increases FN.
This problem illustrates how domain-specific costs can influence metric selection. In spam detection, false positives (important emails blocked) are typically much more costly than false negatives (spam getting through). Understanding the business impact of different error types is crucial for model optimization decisions.
False Positive Cost: Cost of incorrectly predicting positive class
False Negative Cost: Cost of incorrectly predicting negative class
Cost-Sensitive Learning: Optimizing based on error costs
• Consider domain-specific costs of errors
• Prioritize metrics that minimize high-cost errors
• Balance precision and recall based on cost structure
• Calculate actual cost impact of errors
• Prioritize metrics based on business requirements
• Consider cost-sensitive learning approaches
• Not considering the real-world cost of different errors
• Focusing only on numerical metrics
• Ignoring business impact in model optimization
When is the F1-score particularly valuable as an evaluation metric?
The answer is B) When you need to balance precision and recall. The F1-score is the harmonic mean of precision and recall, making it particularly useful when you want to consider both metrics equally. It's especially valuable in imbalanced datasets where accuracy can be misleading, and you need a single metric that captures both the ability to identify positive cases (recall) and the reliability of positive predictions (precision).
Students must understand that F1-score provides a single metric that balances precision and recall. It's particularly useful when there's no clear preference between precision and recall, or when dealing with imbalanced datasets where a single metric is needed to evaluate performance comprehensively. The harmonic mean ensures that both precision and recall must be reasonably high for a good F1-score.
F1-Score: Harmonic mean of precision and recall
Harmonic Mean: Average that gives equal weight to both values
Imbalanced Dataset: Dataset with unequal class distribution
• F1-score balances precision and recall
• Particularly useful for imbalanced data
• Range from 0 to 1, higher is better
• Use F1 when both precision and recall matter
• Better than accuracy for imbalanced datasets
• Favors models that perform well on both metrics
• Thinking F1-score is always the best metric
• Not understanding when to prioritize precision vs recall
• Confusing F1-score with simple average of precision and recall
FAQ
Q: How do I interpret a confusion matrix and what insights can I gain from it?
A: A confusion matrix provides detailed insights into your model's performance:
Reading the Matrix:
- Diagonal Elements: Correct predictions (TP and TN)
- Off-Diagonal Elements: Incorrect predictions (FP and FN)
- Rows: Actual (true) classes
- Columns: Predicted classes
Key Insights:
- Which classes are being confused: Look for high off-diagonal values
- Underperforming classes: Classes with low diagonal values
- Error patterns: Systematic misclassifications between specific classes
- Model bias: Overprediction or underprediction of certain classes
Practical Applications:
- Feature engineering: Identify features that could differentiate confused classes
- Data collection: Collect more data for underperforming classes
- Threshold tuning: Adjust decision thresholds for better balance
- Model selection: Choose algorithms that perform better on your specific problem
The confusion matrix is essential for understanding not just whether your model is accurate, but why it makes mistakes and how to improve it.
Q: What's the difference between precision, recall, and F1-score, and when should I optimize for each?
A: These metrics measure different aspects of classification performance:
Precision: Of all positive predictions, how many were correct?
Formula: \( \text{Precision} = \frac{TP}{TP + FP} \)
Measures the reliability of positive predictions. High precision means fewer false alarms.
Recall (Sensitivity): Of all actual positives, how many did we correctly identify?
Formula: \( \text{Recall} = \frac{TP}{TP + FN} \)
Measures the completeness of positive identification. High recall means fewer misses.
F1-Score: Harmonic mean of precision and recall
Formula: \( \text{F1} = 2 \times \frac{\text{Precision} \times \text{Recall}}{\text{Precision} + \text{Recall}} \)
Provides a single metric that balances both precision and recall.
When to Optimize for Each:
- Precision: When false positives are costly (e.g., medical screening, spam detection, legal discovery)
- Recall: When false negatives are costly (e.g., disease detection, fraud detection, security screening)
- F1-Score: When you need to balance both, or for imbalanced datasets
- Accuracy: When classes are balanced and all errors are equally important
There's typically a trade-off between precision and recall - improving one often degrades the other. The optimal choice depends on your specific application and the relative costs of different types of errors.