F1 Score Calculator
Precision-recall balance & ML metrics • 2026 edition
F1 Score Formula:
Show Calculator\( \text{F1-Score} = 2 \times \frac{\text{Precision} \times \text{Recall}}{\text{Precision} + \text{Recall}} \)
Where:
- \( \text{Precision} = \frac{TP}{TP + FP} \) (of all positive predictions, how many were correct?)
- \( \text{Recall} = \frac{TP}{TP + FN} \) (of all actual positives, how many were identified?)
- \( TP \) = True Positives
- \( FP \) = False Positives
- \( FN \) = False Negatives
Alternative representations:
- \( \text{F1-Score} = \frac{2 \times TP}{2 \times TP + FP + FN} \)
- \( \text{F1-Score} = \frac{\text{Harmonic Mean of Precision and Recall}}{1} \)
- \( \text{F1-Score} \in [0, 1] \) where 1 is perfect and 0 is worst
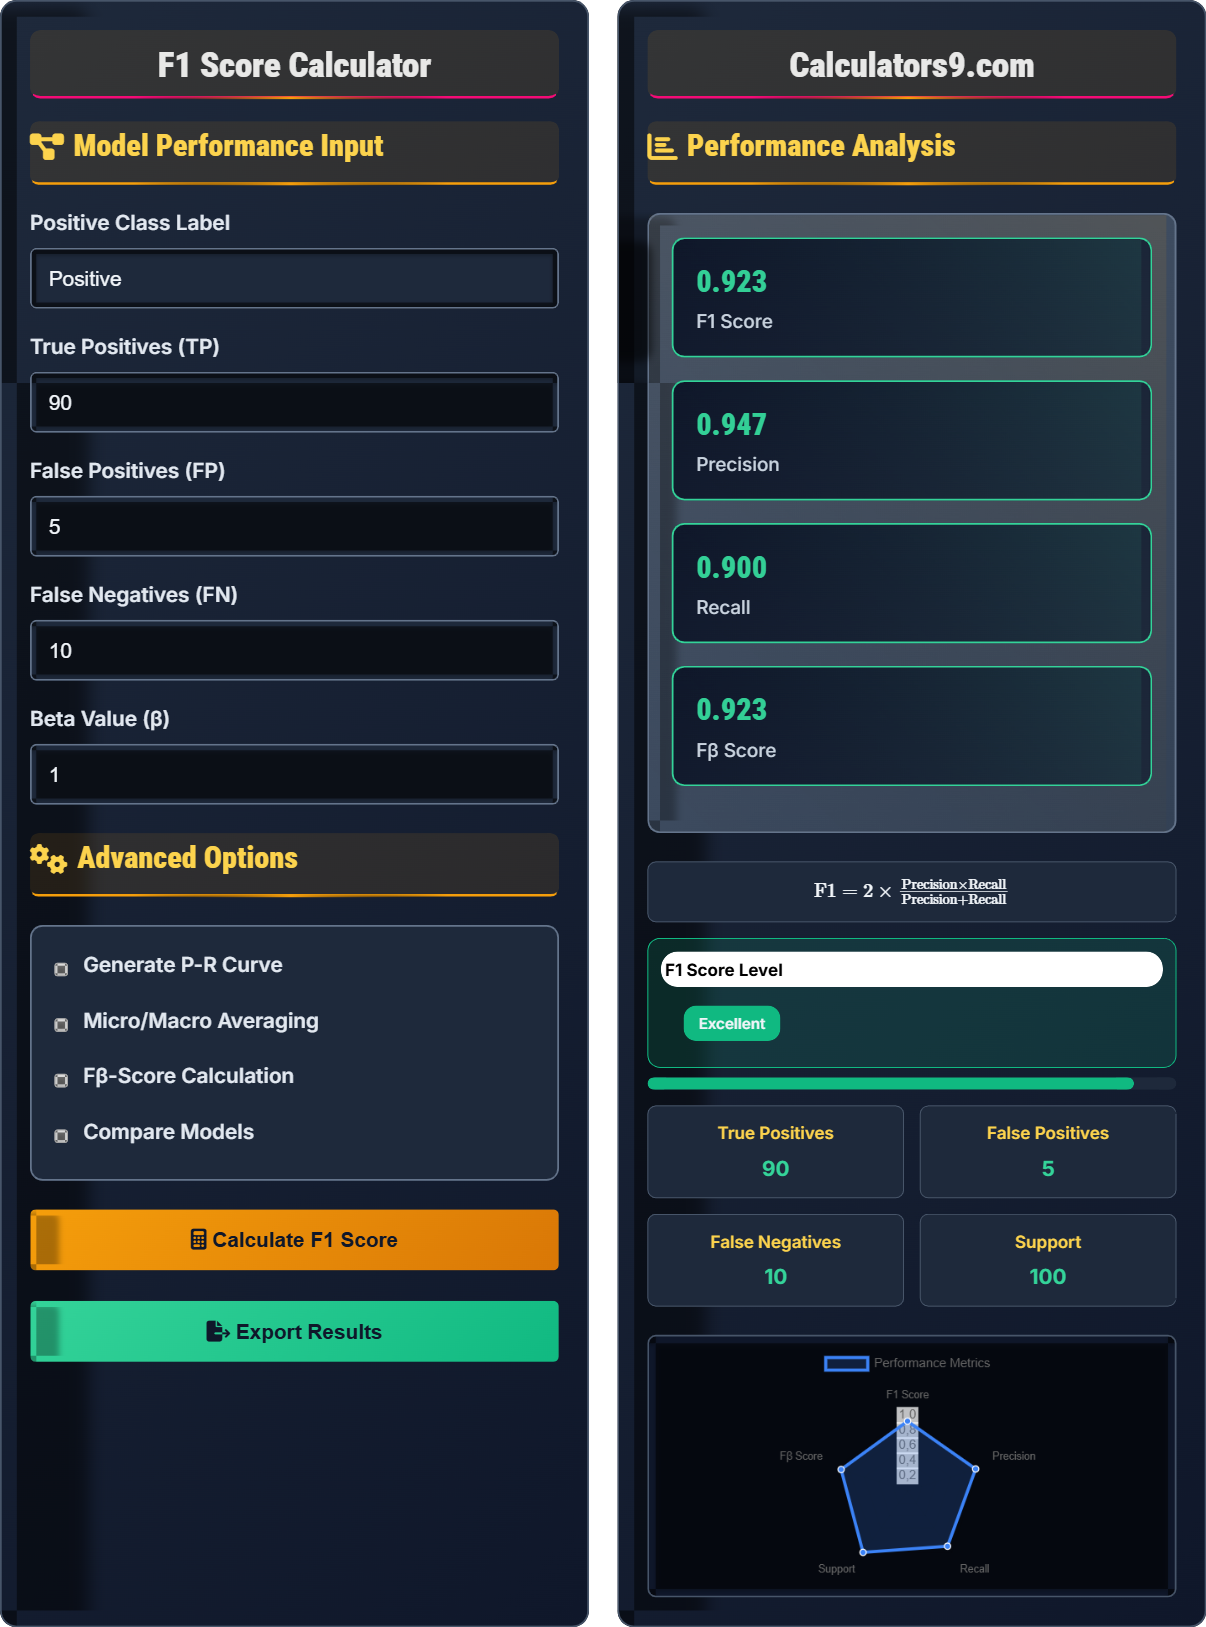
Example: For a model with 90 TP, 5 FP, and 10 FN:
\( \text{Precision} = \frac{90}{90 + 5} = \frac{90}{95} = 0.947 \)
\( \text{Recall} = \frac{90}{90 + 10} = \frac{90}{100} = 0.900 \)
\( \text{F1-Score} = 2 \times \frac{0.947 \times 0.900}{0.947 + 0.900} = 2 \times \frac{0.852}{1.847} = 0.923 \)
The model has an F1-Score of 0.923 (92.3%), indicating excellent balance between precision and recall.
Model Performance Input
Advanced Options
Performance Analysis
| Metric | Value | Interpretation |
|---|---|---|
| F1 Score | 0.923 | Excellent |
| Precision | 0.947 | Excellent |
| Recall | 0.900 | Good |
Comprehensive F1 Score Guide
The F1 Score is a measure of a model's accuracy that considers both precision and recall. It is the harmonic mean of precision and recall, providing a single metric that balances both concerns. The F1 Score is particularly useful when you need to consider both false positives and false negatives equally, making it ideal for imbalanced datasets where accuracy alone can be misleading.
The F1 Score formula:
Alternative representation:
Where TP=True Positives, FP=False Positives, FN=False Negatives.
Choose F1 Score when:
- Imbalanced datasets: When classes are unevenly distributed
- Both errors matter: False positives and false negatives have similar costs
- Single metric needed: To summarize precision and recall in one value
- Model comparison: To compare models with different precision/recall profiles
- Search evaluation: When relevance is important
- Excellent: F1 > 0.90
- Good: F1 0.80-0.90
- Fair: F1 0.70-0.80
- Poor: F1 < 0.70
- Context Matters: Domain-specific thresholds may apply
Metric Fundamentals
Harmonic mean of precision and recall.
\( \text{F1} = 2 \times \frac{\text{Precision} \times \text{Recall}}{\text{Precision} + \text{Recall}} \)
Where Precision and Recall are calculated from TP, FP, FN.
- F1 ranges from 0 to 1 (higher is better)
- Harmonic mean penalizes extreme values
- Perfect balance between precision and recall
Model Development
Systematic approach to assessing model effectiveness and reliability.
- Prepare test dataset
- Generate predictions
- Calculate confusion matrix
- Compute precision and recall
- Calculate F1 score
- Class distribution
- Cost of errors
- Domain requirements
- Statistical significance
F1 Score Learning Quiz
Why is the F1 Score particularly valuable for imbalanced datasets?
The answer is B) It balances precision and recall, preventing accuracy paradox. In imbalanced datasets, accuracy can be misleadingly high. For example, if 95% of samples belong to the negative class, a model that always predicts negative would achieve 95% accuracy but would fail to identify any positive cases. The F1 Score considers both precision (avoiding false positives) and recall (avoiding false negatives), providing a more balanced evaluation of model performance.
Students must understand that accuracy alone is insufficient for imbalanced datasets. The F1 Score addresses this by requiring models to perform well on both positive and negative classes. This is why F1 Score is preferred over accuracy in many real-world applications like fraud detection, medical diagnosis, and information retrieval where class distributions are typically skewed.
Accuracy Paradox: High accuracy with poor minority class performance
Imbalanced Dataset: Unequal distribution of classes
Harmonic Mean: Average that penalizes extreme values
• F1 Score balances precision and recall
• More reliable than accuracy for imbalanced data
• Penalizes models that perform poorly on either metric
• Check class distribution before choosing metrics
• Use F1 for imbalanced classification problems
• Consider both precision and recall in interpretation
• Using accuracy alone for imbalanced datasets
• Not considering the trade-off between precision and recall
• Thinking F1 Score is always better than accuracy
Calculate the F1 Score for a model with 80 TP, 10 FP, and 20 FN. Show your work.
Given: TP=80, FP=10, FN=20
Step 1: Calculate Precision
\( \text{Precision} = \frac{TP}{TP + FP} = \frac{80}{80 + 10} = \frac{80}{90} = 0.889 \)
Step 2: Calculate Recall
\( \text{Recall} = \frac{TP}{TP + FN} = \frac{80}{80 + 20} = \frac{80}{100} = 0.800 \)
Step 3: Calculate F1 Score
\( \text{F1} = 2 \times \frac{\text{Precision} \times \text{Recall}}{\text{Precision} + \text{Recall}} \)
\( \text{F1} = 2 \times \frac{0.889 \times 0.800}{0.889 + 0.800} = 2 \times \frac{0.711}{1.689} = 2 \times 0.421 = 0.842 \)
The F1 Score is 0.842 (84.2%).
This calculation demonstrates how F1 Score balances precision and recall. The model has good precision (88.9%) and decent recall (80.0%), resulting in an F1 Score of 84.2%. The harmonic mean ensures that both metrics must be reasonably high for a good F1 Score. If either precision or recall were much lower, the F1 Score would decrease significantly.
Harmonic Mean: Average that gives equal weight to both values
Precision: Proportion of positive predictions that are correct
Recall: Proportion of actual positives correctly identified
• Always calculate precision and recall first
• Use the harmonic mean formula for F1
• Round to appropriate decimal places
• Remember: F1 = 2 × (Prec × Rec) / (Prec + Rec)
• Both precision and recall must be high for good F1
• F1 Score ≤ min(Precision, Recall)
• Confusing the F1 Score formula
• Forgetting to multiply by 2 in the numerator
• Arithmetic errors in the calculations
A medical diagnostic test for a rare disease has 95 TP, 5 FP, and 10 FN. Calculate the precision, recall, and F1 Score. If missing a positive case (false negative) is 3 times more costly than a false alarm (false positive), should the hospital prioritize F1 Score or a different metric?
Given: TP=95, FP=5, FN=10
Precision calculation:
\( \text{Precision} = \frac{TP}{TP + FP} = \frac{95}{95 + 5} = \frac{95}{100} = 0.950 \) or 95.0%
Recall calculation:
\( \text{Recall} = \frac{TP}{TP + FN} = \frac{95}{95 + 10} = \frac{95}{105} = 0.905 \) or 90.5%
F1 Score calculation:
\( \text{F1} = 2 \times \frac{0.950 \times 0.905}{0.950 + 0.905} = 2 \times \frac{0.860}{1.855} = 0.927 \) or 92.7%
Analysis:
- The test has excellent precision (95.0%) and good recall (90.5%)
- The F1 Score is 92.7%, indicating good balance between precision and recall
- However, since false negatives are 3 times more costly than false positives, the hospital should prioritize recall over precision
- In this case, they might consider F2 Score (which emphasizes recall) or directly optimize for recall
The model has good overall performance, but for this application, recall should be prioritized over F1 Score.
This example demonstrates that while F1 Score is valuable, domain-specific costs should influence metric selection. In medical diagnosis, missing a disease (false negative) is typically much more serious than a false alarm (false positive). When false negatives are more costly, recall becomes more important than the balanced F1 Score. This is why Fβ scores exist to adjust the emphasis between precision and recall.
False Negative Cost: Cost of missing a positive case
False Positive Cost: Cost of incorrectly predicting positive
F2 Score: Fβ score with β=2, emphasizing recall
• Consider domain-specific costs of errors
• Adjust metric emphasis based on cost structure
• F1 Score balances precision and recall equally
• Use F2 Score when recall is more important
• Use F0.5 Score when precision is more important
• Consider cost-sensitive learning approaches
• Not considering the real-world cost of different errors
• Using F1 Score when one type of error is more costly
• Ignoring domain-specific requirements in metric selection
An email service has two spam detection models. Model A has precision=0.95 and recall=0.70. Model B has precision=0.80 and recall=0.90. Calculate the F1 Score for each model. If blocking an important email is 5 times more costly than letting spam through, which model should be chosen?
Model A:
\( \text{F1}_A = 2 \times \frac{0.95 \times 0.70}{0.95 + 0.70} = 2 \times \frac{0.665}{1.65} = 0.806 \)
Model B:
\( \text{F1}_B = 2 \times \frac{0.80 \times 0.90}{0.80 + 0.90} = 2 \times \frac{0.720}{1.70} = 0.847 \)
Comparing models:
- Model A: F1 = 0.806, Precision = 0.95, Recall = 0.70
- Model B: F1 = 0.847, Precision = 0.80, Recall = 0.90
Analysis:
- Model B has a higher F1 Score (0.847 vs 0.806)
- However, Model A has higher precision (0.95 vs 0.80), meaning fewer false positives (important emails blocked)
- Since blocking important emails is 5 times more costly, Model A is preferable despite lower F1 Score
- Model A will block fewer important emails, which is critical given the cost ratio
Model A should be chosen despite having a lower F1 Score because it better addresses the business requirement of minimizing false positives.
This problem illustrates the importance of considering business costs alongside metrics. While Model B has a higher F1 Score, Model A is better for the specific use case because it has higher precision, reducing the number of important emails that get blocked. This demonstrates that F1 Score, while useful, may not always be the best metric for decision-making in practical applications.
False Positive Cost: Cost of incorrectly predicting positive class
False Negative Cost: Cost of incorrectly predicting negative class
Business Context: Real-world implications of model decisions
• Consider domain-specific costs of errors
• F1 Score may not always align with business objectives
• Higher F1 doesn't always mean better for the application
• Calculate actual error costs in business terms
• Consider Fβ scores when one metric is more important
• Always align metrics with business objectives
• Prioritizing F1 Score over business requirements
• Not considering the real-world impact of different errors
• Assuming higher F1 Score always means better model
What is the purpose of the Fβ Score, and when should you use β > 1?
The answer is B) To emphasize recall over precision. The Fβ Score is a generalization of the F1 Score that allows you to weight recall versus precision. When β > 1, recall is given more importance than precision. When β < 1, precision is given more importance than recall. When β = 1, it becomes the standard F1 Score that equally weights both metrics. The formula is: \( \text{Fβ} = (1 + β²) \times \frac{\text{Precision} \times \text{Recall}}{β² \times \text{Precision} + \text{Recall}} \)
Students must understand that Fβ Score provides flexibility in metric selection. The β parameter allows adjustment of the emphasis between precision and recall. This is particularly useful in applications where one type of error is more costly than the other. For example, in medical diagnosis, β > 1 is often used to emphasize recall (avoiding false negatives).
Fβ Score: Generalization of F1 Score with adjustable emphasis
β Parameter: Controls emphasis on recall vs precision
Harmonic Mean: Average that penalizes extreme values
• β > 1 emphasizes recall
• β < 1 emphasizes precision
• β = 1 is standard F1 Score
• Use F2 (β=2) when recall is twice as important
• Use F0.5 (β=0.5) when precision is twice as important
• Consider business requirements for β selection
• Thinking Fβ Score ignores one metric completely
• Confusing β with the weighting direction
• Not understanding when to use different β values
FAQ
Q: What's the difference between F1 Score, F2 Score, and F0.5 Score?
A: These are all variants of the Fβ Score family:
F1 Score (β=1):
- Formula: \( \text{F1} = 2 \times \frac{\text{Precision} \times \text{Recall}}{\text{Precision} + \text{Recall}} \)
- Equal weight to precision and recall
- Best when both false positives and false negatives are equally important
- Most commonly used Fβ variant
F2 Score (β=2):
- Formula: \( \text{F2} = 5 \times \frac{\text{Precision} \times \text{Recall}}{4 \times \text{Precision} + \text{Recall}} \)
- Emphasizes recall 4x more than precision
- Best when false negatives are much more costly than false positives
- Used in medical diagnosis, fraud detection
F0.5 Score (β=0.5):
- Formula: \( \text{F0.5} = 1.25 \times \frac{\text{Precision} \times \text{Recall}}{0.25 \times \text{Precision} + \text{Recall}} \)
- Emphasizes precision 4x more than recall
- Best when false positives are much more costly than false negatives
- Used in spam detection, legal document review
The β parameter controls the balance between precision and recall based on the relative importance of different types of errors in your specific application.
Q: When should I use F1 Score instead of accuracy, precision, or recall?
A: Here's when to use each metric:
Use F1 Score when:
- Imbalanced datasets: When classes have unequal distribution
- Equal importance: When false positives and false negatives are equally costly
- Single metric: When you need one number to represent performance
- Model comparison: When comparing models with different precision/recall profiles
- Search evaluation: When relevance is important
Use Accuracy when:
- Balanced datasets: When classes are roughly equal
- All errors equal: When all misclassifications have similar cost
- Simple evaluation: When interpretability is important
Use Precision when:
- False positives costly: When it's important to avoid false alarms
- Spam detection: When blocking important emails is problematic
- Medical screening: When false positives cause unnecessary stress
Use Recall when:
- False negatives costly: When missing positive cases is problematic
- Disease detection: When missing a disease is dangerous
- Fraud detection: When missing fraud is costly
The key is to align your metric choice with your specific problem requirements and the relative costs of different types of errors.