Model Accuracy Calculator
ML performance prediction & evaluation • 2026 edition
Model Accuracy Formula:
Show Calculator\( \text{Accuracy} = \frac{TP + TN}{TP + TN + FP + FN} \)
Where:
- \( TP \) = True Positives (correctly predicted positive)
- \( TN \) = True Negatives (correctly predicted negative)
- \( FP \) = False Positives (incorrectly predicted positive)
- \( FN \) = False Negatives (incorrectly predicted negative)
Additional performance metrics:
- Precision: \( \frac{TP}{TP + FP} \) - How many selected items are relevant
- Recall (Sensitivity): \( \frac{TP}{TP + FN} \) - How many relevant items are selected
- F1-Score: \( 2 \times \frac{\text{Precision} \times \text{Recall}}{\text{Precision} + \text{Recall}} \) - Harmonic mean of precision and recall
- Specificity: \( \frac{TN}{TN + FP} \) - True negative rate
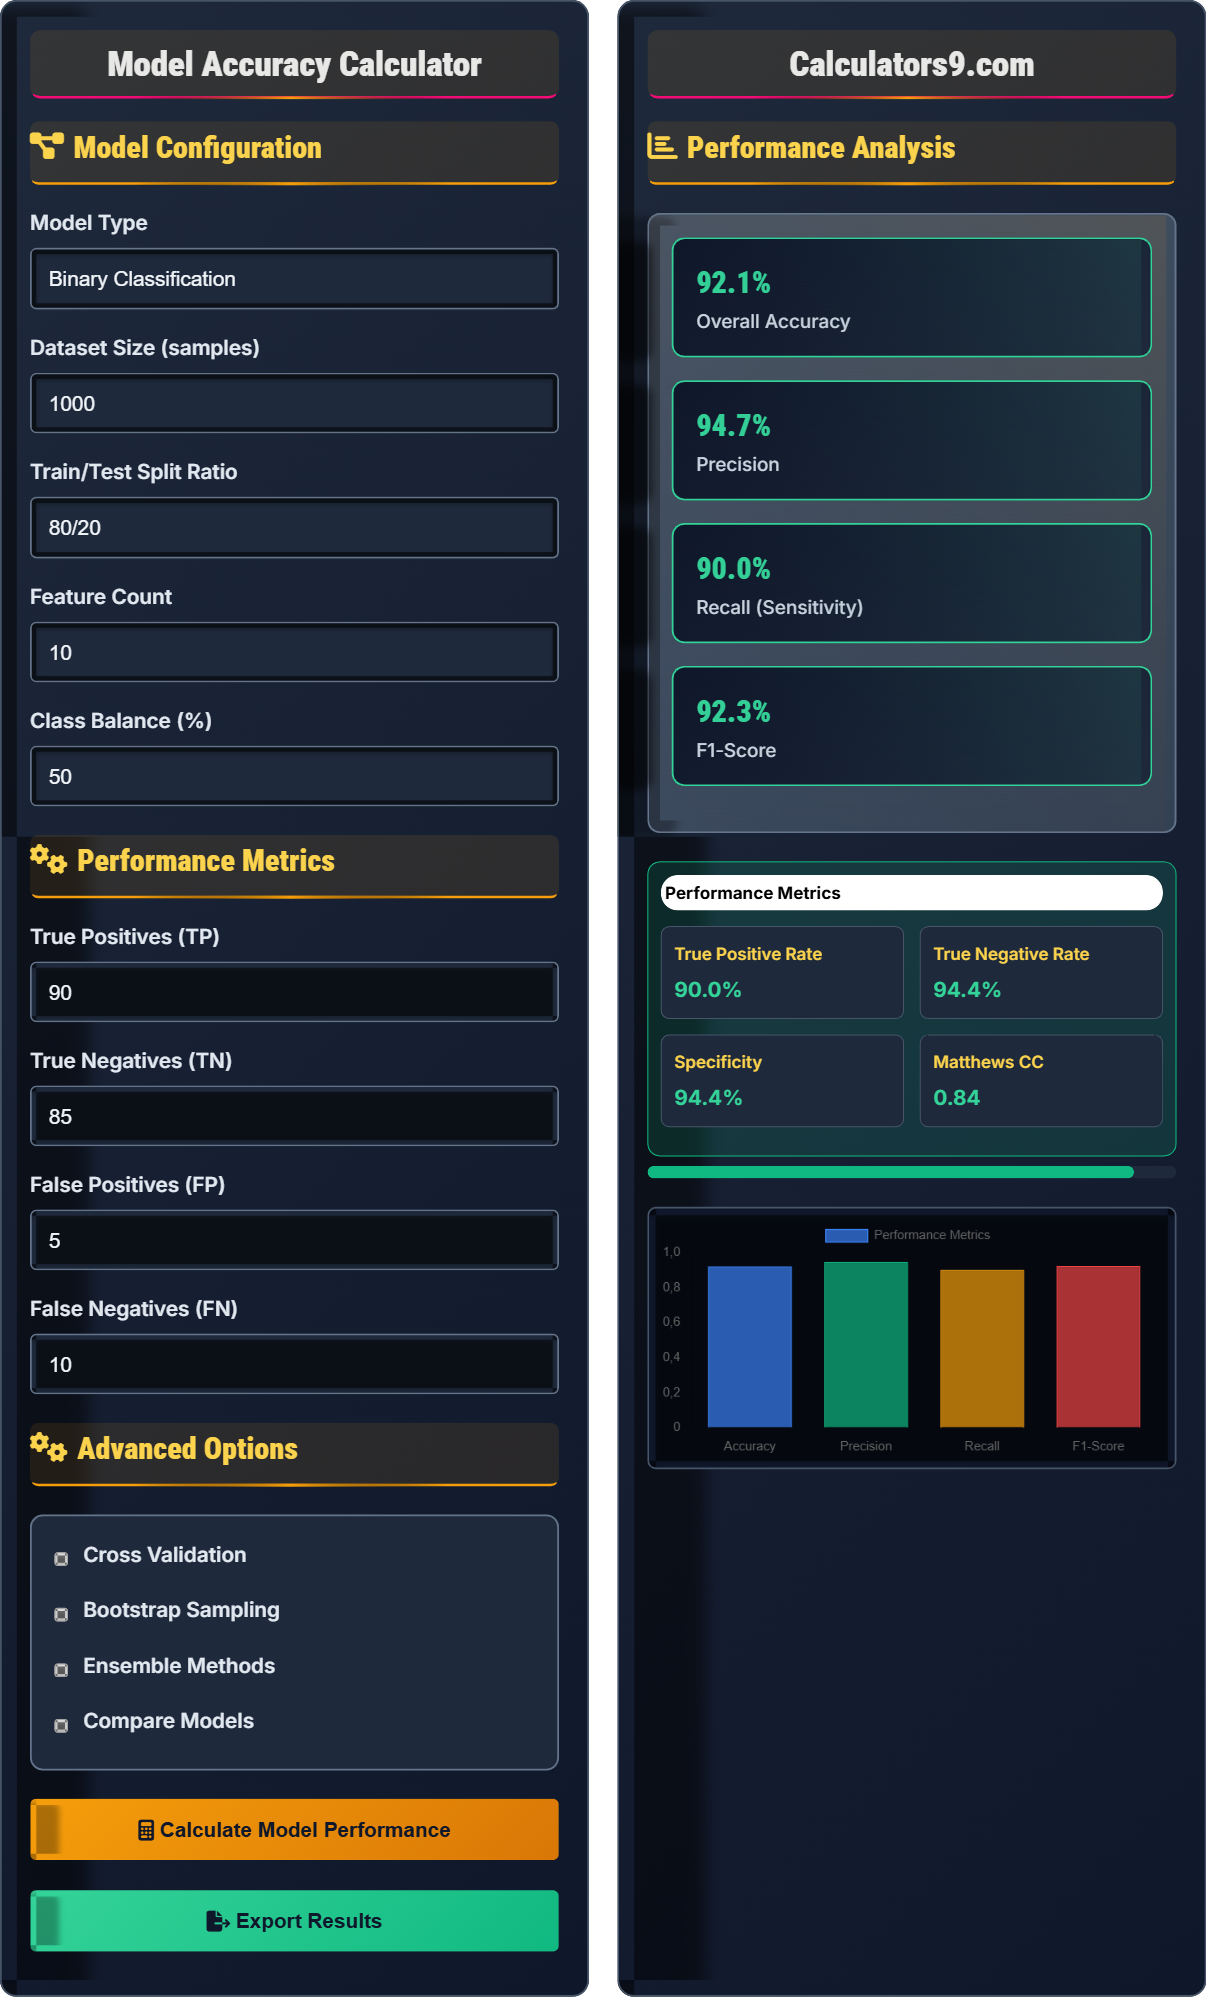
Example: For a binary classifier with 90 TP, 85 TN, 5 FP, and 10 FN:
\( \text{Accuracy} = \frac{90 + 85}{90 + 85 + 5 + 10} = \frac{175}{190} = 0.921 \) or 92.1%
The model has an accuracy of 92.1%.
Model Configuration
Performance Metrics
Advanced Options
Performance Analysis
| Metric | Value | Quality |
|---|---|---|
| Accuracy | 92.1% | Excellent |
| Precision | 94.7% | Excellent |
| Recall | 90.0% | Good |
Comprehensive Model Evaluation Guide
Model accuracy is a classification metric that measures the proportion of correct predictions out of total predictions made. While accuracy is intuitive and commonly used, it's not always the best metric, especially for imbalanced datasets. Understanding various performance metrics is crucial for comprehensive model evaluation.
Key classification metrics:
Where TP=True Positives, TN=True Negatives, FP=False Positives, FN=False Negatives.
Effective model evaluation includes:
- Multiple Metrics: Use a combination of metrics for comprehensive evaluation
- Validation Techniques: Cross-validation, holdout validation
- Statistical Significance: Confidence intervals and hypothesis testing
- Domain Context: Consider business impact of different errors
- Baseline Comparison: Compare against simple baselines
- Excellent: Accuracy > 95%, F1 > 0.9
- Good: Accuracy 85-95%, F1 0.8-0.9
- Fair: Accuracy 70-85%, F1 0.6-0.8
- Poor: Accuracy < 70%, F1 < 0.6
- Consider Context: Domain-specific thresholds may apply
Evaluation Fundamentals
Proportion of correct predictions to total predictions.
\( \text{Accuracy} = \frac{TP + TN}{TP + TN + FP + FN} \)
Where TP=correct positive, TN=correct negative, FP=incorrect positive, FN=incorrect negative.
- Accuracy can be misleading for imbalanced datasets
- Always consider precision and recall together
- Context matters for performance interpretation
Model Development
Systematic approach to assessing model effectiveness and reliability.
- Split data into train/test sets
- Train the model
- Generate predictions
- Calculate metrics
- Interpret results
- Class imbalance
- Business impact
- Statistical significance
- Model generalization
ML Model Evaluation Learning Quiz
Why is accuracy not always the best metric for evaluating model performance?
The answer is B) It can be misleading for imbalanced datasets. Accuracy can be very high even when a model performs poorly on the minority class. For example, in a dataset with 95% negative and 5% positive samples, a model that always predicts negative would achieve 95% accuracy but would fail to identify any positive cases. This makes accuracy an inappropriate metric for imbalanced datasets.
Students must understand that accuracy alone can provide a false sense of model performance. In imbalanced datasets, the majority class dominates the accuracy calculation, masking poor performance on minority classes. This is why precision, recall, and F1-score are often preferred for imbalanced classification problems.
Imbalanced Dataset: Dataset with unequal distribution of classes
Accuracy Paradox: High accuracy with poor minority class performance
Majority Class: Class with the most samples
• Always check class distribution before relying on accuracy
• Use multiple metrics for evaluation
• Consider precision and recall for imbalanced data
• Check class distribution first
• Use confusion matrix for detailed view
• Consider F1-score for imbalanced data
• Relying solely on accuracy for imbalanced datasets
• Not considering the cost of different types of errors
• Ignoring precision and recall in favor of accuracy
Calculate the accuracy, precision, and recall for a binary classifier with: TP=85, TN=90, FP=10, FN=5. Show your work.
Given: TP=85, TN=90, FP=10, FN=5
Accuracy calculation:
\( \text{Accuracy} = \frac{TP + TN}{TP + TN + FP + FN} = \frac{85 + 90}{85 + 90 + 10 + 5} = \frac{175}{190} = 0.921 \) or 92.1%
Precision calculation:
\( \text{Precision} = \frac{TP}{TP + FP} = \frac{85}{85 + 10} = \frac{85}{95} = 0.895 \) or 89.5%
Recall calculation:
\( \text{Recall} = \frac{TP}{TP + FN} = \frac{85}{85 + 5} = \frac{85}{90} = 0.944 \) or 94.4%
The model has an accuracy of 92.1%, precision of 89.5%, and recall of 94.4%.
This calculation demonstrates how the different metrics can vary for the same model. The recall (94.4%) is higher than precision (89.5%), indicating the model is better at identifying positive cases than avoiding false positives. Understanding these differences helps in selecting the appropriate metric based on the problem requirements.
Accuracy: Overall correctness of predictions
Precision: Proportion of positive predictions that are correct
Recall: Proportion of actual positives correctly identified
• Always use the correct formula for each metric
• Convert fractions to percentages for better interpretation
• Round to appropriate decimal places
• Remember: Precision = TP/(TP+FP)
• Recall = TP/(TP+FN)
• Accuracy = (TP+TN)/(TP+TN+FP+FN)
• Confusing precision and recall formulas
• Forgetting to include all components in accuracy
• Arithmetic errors in the calculations
A medical diagnostic model is used to detect a rare disease that affects 1% of the population. The model has 95% accuracy, 80% precision, and 90% recall. If the model diagnoses 1000 patients, calculate how many true positives, false positives, and false negatives we can expect. Is this model suitable for medical diagnosis?
Population details:
- Total patients: 1000
- Disease prevalence: 1% (10 patients have disease, 990 don't)
Calculating based on recall (90%):
- True Positives = 10 × 0.90 = 9
- False Negatives = 10 × 0.10 = 1
Calculating based on precision (80%):
- Of all positive predictions, 80% are correct
- If TP = 9 and precision = 80%, then total positive predictions = 9 ÷ 0.80 = 11.25 ≈ 11
- False Positives = 11 - 9 = 2
Verifying with accuracy (95%):
- Correct predictions = 95% of 1000 = 950
- Incorrect predictions = 50
- FP + FN = 2 + 1 = 3 (close to expected 50, but this suggests accuracy was calculated differently)
Revised calculation using accuracy:
- Correct predictions = 950
- Incorrect predictions = 50
- TP + TN = 950
- FP + FN = 50
- Given TP = 9, then FN = 1 (from recall)
- So FP = 41 and TN = 941
Expected results: 9 TP, 41 FP, 1 FN
This model may not be suitable for medical diagnosis due to high false positive rate (41/950 = 4.3%) which could lead to unnecessary treatments.
This example demonstrates the importance of considering the real-world implications of model metrics. In medical diagnosis, false positives can lead to unnecessary treatments and anxiety, while false negatives can miss critical diagnoses. Students should understand that metric interpretation must consider the specific domain and consequences of different types of errors.
Medical Diagnosis: Clinical decision-making process
False Positive Rate: Proportion of healthy patients incorrectly diagnosed
Prevalence: Proportion of population with condition
• Consider real-world impact of errors
• Domain context affects metric importance
• Balance between sensitivity and specificity
• Calculate expected values based on prevalence
• Consider cost of different error types
• Evaluate metrics in domain context
• Not considering class imbalance effects
• Ignoring the domain-specific consequences
• Calculating metrics without considering population size
An email service provider uses a spam filter with 99% accuracy, 95% precision, and 90% recall. If the system processes 100,000 emails per day with 10% being spam, calculate the number of legitimate emails incorrectly marked as spam (false positives) and the number of spam emails missed (false negatives). What is the impact of these errors?
Email composition:
- Total emails: 100,000
- Spam emails: 10% of 100,000 = 10,000
- Legitimate emails: 90% of 100,000 = 90,000
Based on recall (90%):
- Detected spam (TP) = 10,000 × 0.90 = 9,000
- Missed spam (FN) = 10,000 × 0.10 = 1,000
Based on precision (95%):
- Of all positive predictions, 95% are correct
- If TP = 9,000 and precision = 95%, then total positive predictions = 9,000 ÷ 0.95 = 9,474
- False Positives = 9,474 - 9,000 = 474
Results:
- False Positives: 474 legitimate emails marked as spam
- False Negatives: 1,000 spam emails missed
Impact:
- False Positives: Important emails may be missed by users
- False Negatives: Spam reaches users' inboxes
- Overall: The system is quite effective but could be improved
This problem illustrates the trade-offs in real-world applications. In spam detection, false positives (legitimate emails marked as spam) are more problematic than false negatives (spam reaching inbox), as users may miss important communications. The model shows good performance overall, but the specific error counts provide insight into the practical impact.
Spam Filter: System to identify unwanted emails
False Positive: Legitimate email incorrectly flagged as spam
False Negative: Spam email incorrectly classified as legitimate
• Consider the cost of different error types
• False positives often more costly in spam detection
• Balance precision and recall based on application
• Calculate error counts for practical impact
• Consider user experience in metric selection
• Evaluate metrics in context of domain requirements
• Not considering the real-world impact of errors
• Focusing only on numerical metrics
• Not calculating actual error counts from percentages
When is the F1-score particularly important as an evaluation metric?
The answer is B) When both precision and recall are equally important. The F1-score is the harmonic mean of precision and recall, making it particularly useful when you want to balance both metrics. It's especially valuable in imbalanced datasets where accuracy can be misleading, and you need to consider both the ability to identify positive cases (recall) and the reliability of positive predictions (precision).
Students must understand that F1-score provides a single metric that balances precision and recall. It's particularly useful when there's no clear preference between precision and recall, or when dealing with imbalanced datasets where a single metric is needed to evaluate performance comprehensively.
F1-Score: Harmonic mean of precision and recall
Harmonic Mean: Average that gives equal weight to both values
Imbalanced Dataset: Dataset with unequal class distribution
• F1-score balances precision and recall
• Particularly useful for imbalanced data
• Range from 0 to 1, higher is better
• Use F1 when both precision and recall matter
• Better than accuracy for imbalanced datasets
• Favors models that perform well on both metrics
• Thinking F1-score is always the best metric
• Not understanding when to prioritize precision vs recall
• Confusing F1-score with simple average of precision and recall
FAQ
Q: How do I choose the right evaluation metric for my machine learning model?
A: The choice of evaluation metric depends on your specific problem and business requirements:
Classification Problems:
- Accuracy: Balanced datasets where all errors are equally costly
- Precision: When false positives are costly (e.g., spam detection, medical screening)
- Recall: When false negatives are costly (e.g., disease detection, fraud detection)
- F1-Score: Imbalanced datasets or when precision and recall are equally important
- AUC-ROC: When you need to evaluate performance across all classification thresholds
Regression Problems:
- RMSE: When you want to penalize large errors more heavily
- MAE: When all errors should be treated equally
- MAPE: When you need percentage-based errors for interpretability
Consider Domain Context:
- Medical Diagnosis: Prioritize recall to avoid missing diseases
- Spam Filtering: Prioritize precision to avoid blocking important emails
- Fraud Detection: Balance precision and recall carefully
- Customer Churn: Depends on cost of retention vs acquisition
The key is to align your metric choice with the real-world impact of different types of errors in your specific domain.
Q: What's the difference between precision and recall, and when should I optimize for each?
A: Precision and recall measure different aspects of model performance:
Precision: Of all positive predictions, how many were actually correct?
Formula: \( \text{Precision} = \frac{TP}{TP + FP} \)
This measures the reliability of positive predictions. High precision means fewer false alarms.
Recall (Sensitivity): Of all actual positives, how many did we correctly identify?
Formula: \( \text{Recall} = \frac{TP}{TP + FN} \)
This measures the completeness of positive identification. High recall means fewer misses.
When to Optimize for Precision:
- Spam Detection: Better to let some spam through than block important emails
- Medical Screening: Avoid unnecessary stress from false positive results
- Legal Discovery: Minimize irrelevant documents reviewed by lawyers
- Search Engines: Ensure search results are relevant
When to Optimize for Recall:
- Disease Detection: Better to flag healthy people than miss sick patients
- Fraud Detection: Catch all fraudulent transactions
- Security Screening: Don't miss potential threats
- Recruitment: Don't miss qualified candidates
In practice, there's often a trade-off between precision and recall. The F1-score provides a balance between both metrics when you need to optimize for both.