Function Grapher
Calculus visualization tool • 2026 edition
Function Graphing Formula:
Show the calculator\( y = f(x) \)
For graphing, we plot ordered pairs \((x, f(x))\) on a coordinate plane where:
- \( x \) = Independent variable (horizontal axis)
- \( y = f(x) \) = Dependent variable (vertical axis)
- Domain: All possible x-values
- Range: All possible y-values
Common transformations:
- \( f(x) + c \) = Vertical shift
- \( f(x + c) \) = Horizontal shift
- \( cf(x) \) = Vertical stretch/compression
- \( f(cx) \) = Horizontal stretch/compression
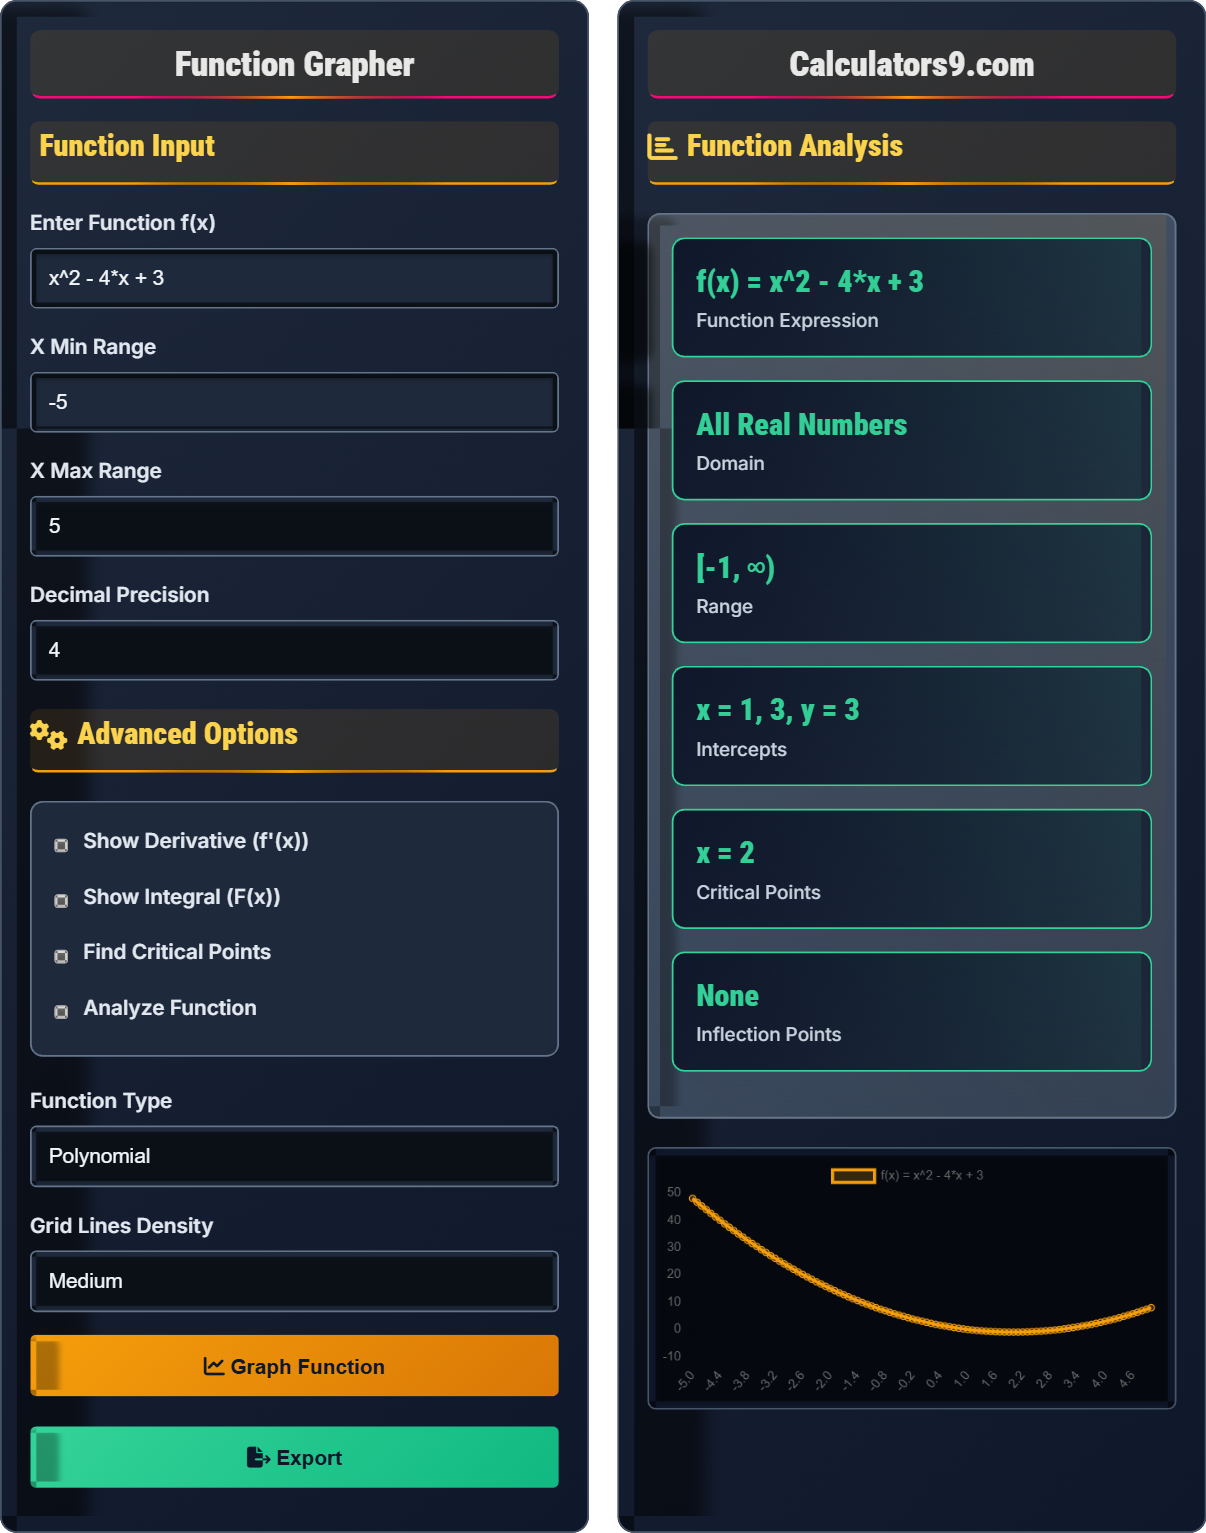
Example: \( f(x) = x^2 - 4x + 3 \) creates a parabola with vertex at (2, -1).
Function Input
Advanced Options
Function Analysis
| Feature | Value | Description |
|---|---|---|
| Function | x² - 4x + 3 | Quadratic function |
| Domain | (-∞, ∞) | All real numbers |
| Range | [-1, ∞) | All values ≥ -1 |
| X-Intercepts | x = 1, 3 | Where f(x) = 0 |
| Y-Intercept | y = 3 | f(0) = 3 |
| Vertex | (2, -1) | Minimum point |
| Axis of Symmetry | x = 2 | Line of symmetry |
| Property | Expression | Value |
|---|---|---|
| Original Function | f(x) = x² - 4x + 3 | Quadratic |
| First Derivative | f'(x) = 2x - 4 | Linear |
| Second Derivative | f''(x) = 2 | Constant |
| Integral | F(x) = (1/3)x³ - 2x² + 3x + C | Cubic |
| Critical Point | f'(x) = 0 | x = 2 |
| Inflection Point | f''(x) = 0 | None |
Comprehensive Function Graphing Guide
Function graphing is the process of visually representing a mathematical function by plotting ordered pairs (x, f(x)) on a coordinate plane. The graph provides insights into the behavior, properties, and relationships of the function, including domain, range, intercepts, extrema, and inflection points.
Important characteristics to analyze:
For example, the domain of f(x) = 1/x is all real numbers except x = 0, and the range is all real numbers except y = 0.
Functions can be classified into categories based on their form:
- Linear: f(x) = ax + b (straight line)
- Quadratic: f(x) = ax² + bx + c (parabola)
- Polynomial: f(x) = aₙxⁿ + ... + a₁x + a₀
- Exponential: f(x) = aˣ (exponential growth/decay)
- Logarithmic: f(x) = log_a(x)
- Trigonometric: f(x) = sin(x), cos(x), tan(x)
- Plot Key Points: Intercepts, extrema, and other significant points
- Use Symmetry: Plot one side and reflect for symmetric functions
- Check End Behavior: Analyze limits as x approaches ±∞
- Identify Asymptotes: Draw guide lines for infinite behavior
- Verify with Derivatives: Use f'(x) and f''(x) for shape analysis
Graphing Basics
A relation where each input has exactly one output.
Plot (x, f(x)) points and connect with smooth curve.
- Each x-value maps to only one y-value
- Vertical line test: intersects graph at most once
- Domain restrictions affect graph shape
- Asymptotes indicate undefined behavior
Analysis
Study of function behavior using calculus tools.
- First derivative: increasing/decreasing
- Second derivative: concavity
- Asymptotes: end behavior
- Intercepts: crossing points
- Check for discontinuities
- Identify critical points
- Consider domain restrictions
- Verify with multiple methods
Function Graphing Learning Quiz
For the function f(x) = x³ - 3x², which statement is TRUE?
The answer is D) The function has an inflection point at x = 1. To find critical points, take the first derivative: f'(x) = 3x² - 6x = 3x(x - 2). Setting f'(x) = 0 gives x = 0 and x = 2 as critical points. For inflection points, take the second derivative: f''(x) = 6x - 6. Setting f''(x) = 0 gives x = 1. Testing concavity: f''(0) = -6 (concave down), f''(2) = 6 (concave up), confirming x = 1 is an inflection point.
This problem demonstrates the importance of using derivatives to analyze function behavior. Critical points occur where f'(x) = 0, indicating potential local extrema. Inflection points occur where f''(x) = 0 and the concavity changes. For the function f(x) = x³ - 3x², we see that the function has both critical points and an inflection point, showing how derivatives reveal the function's structure.
Critical Point: Where f'(x) = 0 or f'(x) is undefined
Inflection Point: Where f''(x) = 0 and concavity changes
Concavity: Direction of curvature (upward/downward)
• f'(x) > 0 ⇒ increasing function
• f'(x) < 0 ⇒ decreasing function
• f''(x) > 0 ⇒ concave up
• Always check second derivative for inflection points
• Use first derivative to find critical points
• Confusing critical points with inflection points
• Not verifying concavity change at inflection points
Graph the function f(x) = (x² - 4)/(x - 2) and identify all key features including domain, range, intercepts, and asymptotes.
1. Simplify: f(x) = (x² - 4)/(x - 2) = (x+2)(x-2)/(x-2) = x + 2 for x ≠ 2
2. Domain: All real numbers except x = 2 (hole at x = 2)
3. Range: All real numbers except y = 4 (since f(2) would be 4, but x ≠ 2)
4. X-intercept: x + 2 = 0, so x = -2
5. Y-intercept: f(0) = (0-4)/(0-2) = 2
6. Vertical asymptote: None (hole at x = 2)
7. Horizontal asymptote: None (linear function)
The graph is a line y = x + 2 with a hole at point (2, 4).
This problem illustrates how factoring can reveal hidden properties of rational functions. Initially, the function appears to have a vertical asymptote at x = 2, but factoring reveals a removable discontinuity (hole) instead. The key insight is recognizing when a factor in the numerator and denominator can be canceled, indicating a hole rather than an asymptote. This highlights the importance of algebraic manipulation before graphing.
Removable Discontinuity: Hole in graph where factor cancels
Vertical Asymptote: Vertical line where function approaches infinity
Domain Restriction: Values where function is undefined
• Factor numerator and denominator
• Cancel common factors (creates holes)
• Remaining zeros in denominator create asymptotes
• Always factor rational functions first
• Check for common factors that create holes
• Missing holes when factors cancel
• Incorrectly identifying asymptotes
FAQ
Q: How do I determine the domain of a function from its graph?
A: The domain of a function is the set of all possible x-values for which the function is defined. On a graph, the domain corresponds to the horizontal extent of the graph. Look for:
1. Starting and ending points: If the graph begins at x = a and ends at x = b, the domain is [a, b]
2. Holes: If there's a hole at x = c, exclude c from the domain
3. Vertical asymptotes: If there's a vertical asymptote at x = c, exclude c from the domain
4. Behavior at infinity: If the graph extends infinitely in either direction, include those ranges
For example, if a function has a vertical asymptote at x = 2, its domain would be (-∞, 2) ∪ (2, ∞).
Q: What's the difference between a relative and absolute extremum?
A: A relative extremum (local maximum or minimum) is the highest or lowest point in a neighborhood around that point, but not necessarily the highest or lowest point overall. An absolute extremum (global maximum or minimum) is the highest or lowest point on the entire domain.
Mathematically:
• Relative maximum at x = c: f(c) ≥ f(x) for all x in some open interval containing c
• Absolute maximum at x = c: f(c) ≥ f(x) for all x in the domain
• Relative minimum at x = c: f(c) ≤ f(x) for all x in some open interval containing c
• Absolute minimum at x = c: f(c) ≤ f(x) for all x in the domain
A function can have multiple relative extrema but only one absolute maximum and one absolute minimum.