Baby Growth Chart Calculator
Pediatric growth tracking tool • 2026 standards
Growth Percentile Formula:
Show the calculator\( \text{Percentile} = \left( \frac{\text{Rank of Measurement}}{\text{Total Number of Measurements}} \right) \times 100 \)
Where:
- \( \text{Rank of Measurement} \) = position of baby's measurement in growth chart
- \( \text{Total Number of Measurements} \) = reference population size
This formula calculates the percentile rank of a baby's measurements compared to standardized growth charts from the WHO or CDC.
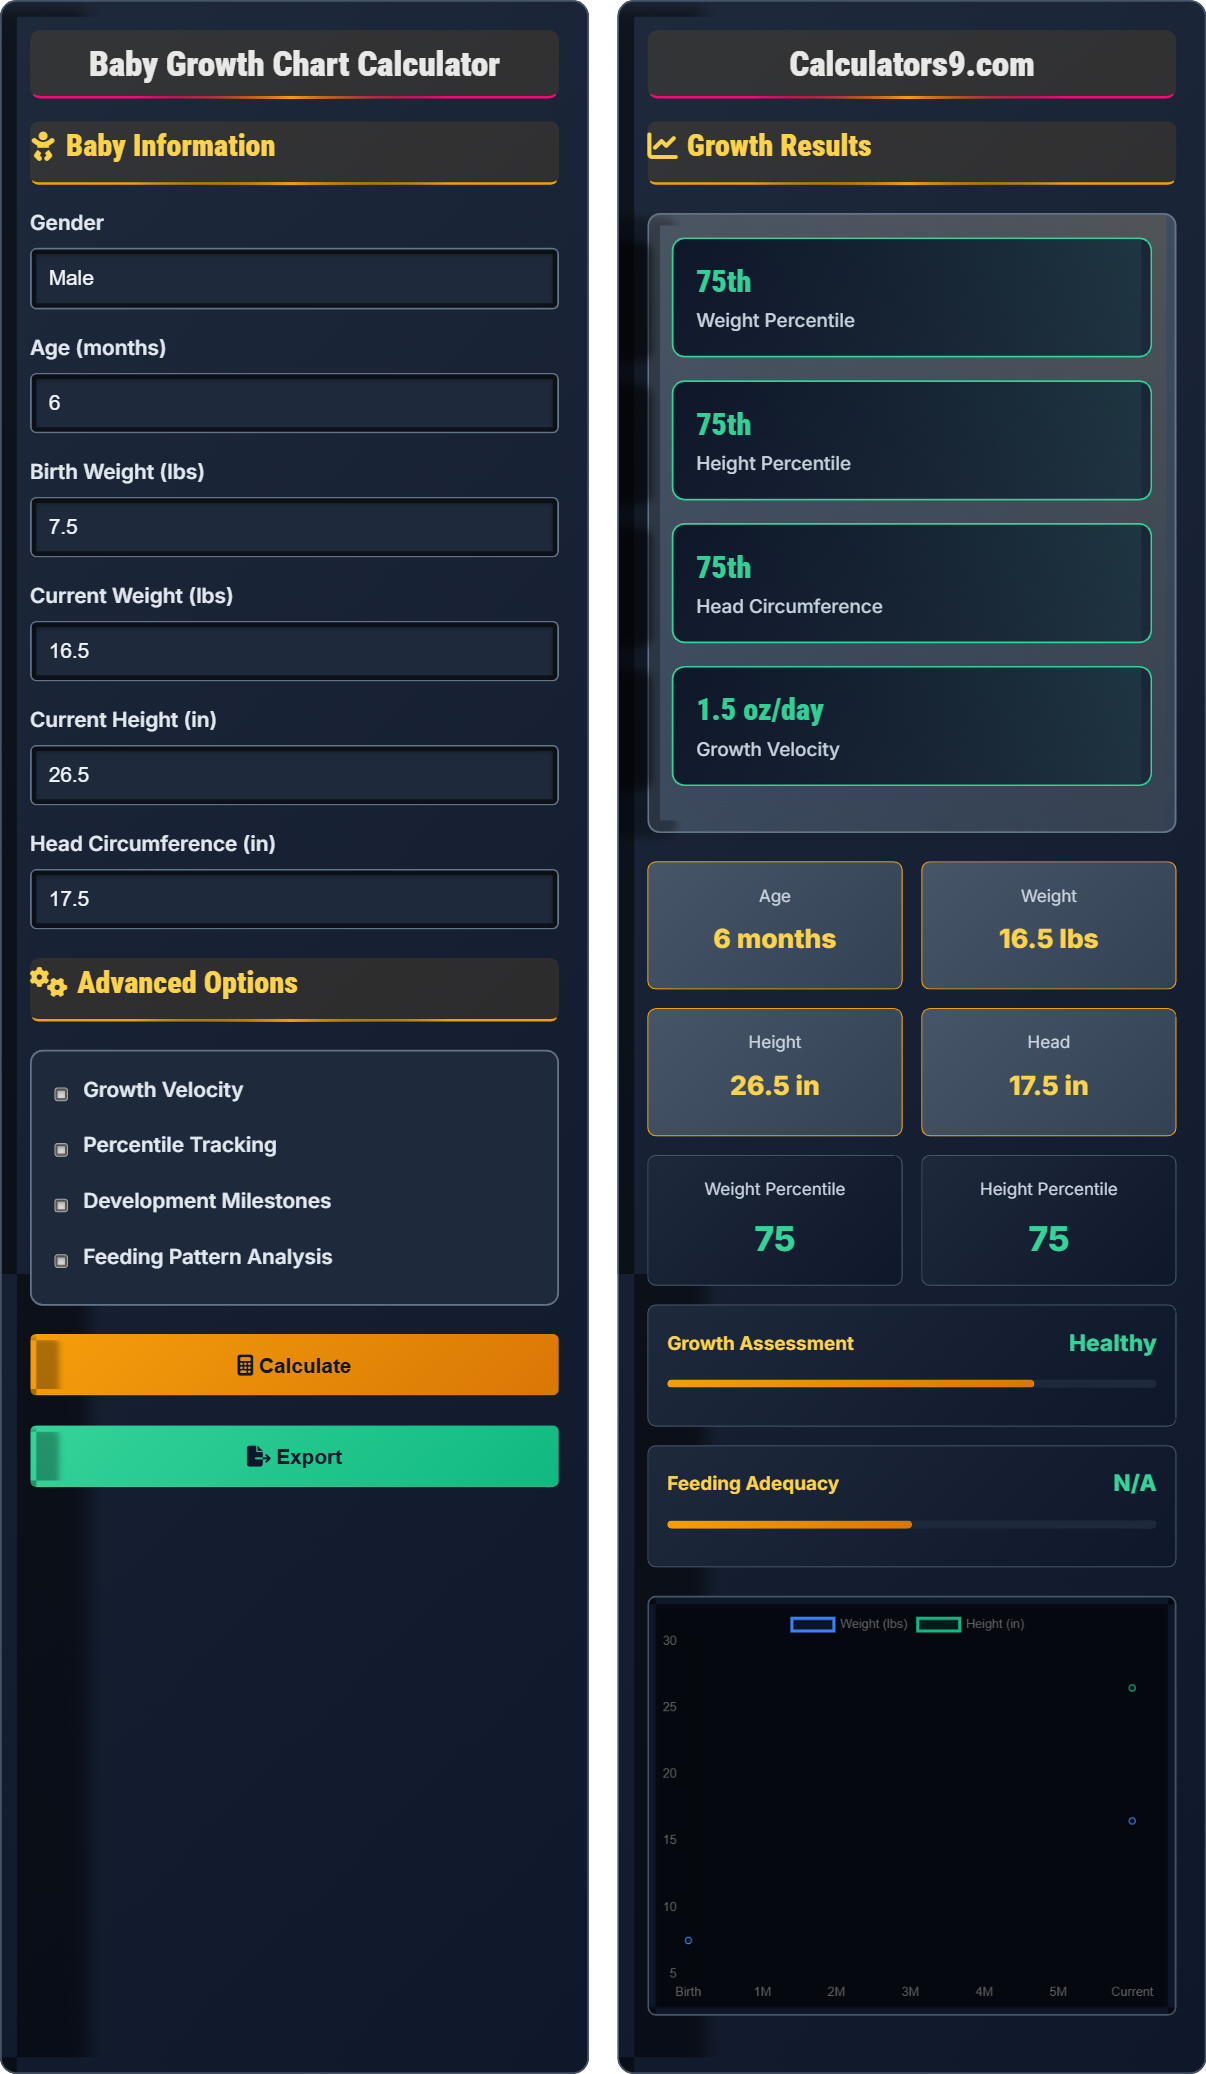
Example: For a 6-month-old male baby weighing 16.5 lbs, the percentile is calculated by comparing to WHO growth standards. If 85% of babies in the reference population weigh less than 16.5 lbs, the baby is at the 85th percentile.
Percentiles help assess if a child's growth is within normal ranges. A healthy baby typically grows along consistent percentile lines, even if they're in the 5th or 95th percentile.
Baby Information
Advanced Options
Growth Results
| Measurement | Value | Percentile | Status |
|---|
| Milestone | Expected Age | Status |
|---|
| Feeding Metric | Recommended | Current | Status |
|---|
Baby Growth Tracking Fundamentals
Growth percentile tracking is the systematic monitoring of a baby's physical development compared to standardized growth charts from the World Health Organization (WHO) or Centers for Disease Control and Prevention (CDC). These percentiles indicate how a baby's measurements compare to other babies of the same age and gender.
Where:
- \( \text{Growth Velocity} \) = rate of weight gain over time
- \( \text{Time Interval} \) = days between measurements
- Weight Gain: 5-7 oz per week in first 3 months, 4-6 oz per week 3-6 months
- Length Increase: 1-1.5 inches per month in first 6 months
- Head Circumference: 0.5 inches per month in first 6 months
- Percentile Consistency: Healthy babies grow along consistent percentile curves
Growth Percentiles Explained
Growth Monitoring Tips
- Consistent Timing: Weigh and measure at the same time of day for accuracy
- Same Equipment: Use the same scale and measuring tape for consistency
- Record Regularly: Track measurements every 1-2 weeks for infants
- Plot Trends: Look for consistent growth patterns rather than individual readings
- Consult Professionals: Discuss concerns with pediatrician before making feeding changes
- Comparing babies to each other instead of tracking individual growth
- Worrying about single measurements rather than growth trends
- Using adult scales for infant weights
- Measuring at inconsistent times of day
- Ignoring head circumference measurements
Baby Growth Tracking Quiz
A 4-month-old baby girl weighs 14.5 pounds, which places her at the 90th percentile for weight. What does this mean?
The answer is B) 90% of babies her age weigh less than her. A percentile ranking indicates the percentage of children in the reference population who have a measurement value less than the child's value. So, being at the 90th percentile means 90% of babies her age and gender weigh less than she does, and only 10% weigh more.
Growth percentiles are based on standardized growth charts from large populations of healthy children. The percentile indicates where a child falls in relation to peers, not how close they are to an "ideal" weight. A child at the 5th percentile is as healthy as one at the 95th percentile, as long as they are growing consistently along their own growth curve.
Percentile: The percentage of children in the reference population with a lower measurement value
Reference Population: Large sample of healthy children used to create growth standards
Growth Curve: Pattern of growth over time, plotted on standardized charts
• Percentiles are not goals but rather descriptive statistics of where a child stands
• Consistent growth along the same percentile line is more important than the specific percentile
• Growth charts differ by age, gender, and organization (WHO vs CDC)
• Remember "percentile" means "per hundred" - it's the percentage out of 100 children
• Use the "track, don't compare" principle when monitoring growth
• Thinking higher percentiles are always better
A 3-month-old baby weighed 12.0 lbs at their 2-month checkup and now weighs 13.8 lbs at their 3-month checkup. Calculate the baby's growth velocity in ounces per day and evaluate if this is within normal ranges. Show your work and explain the significance of growth velocity in pediatric care.
Weight gained: 13.8 lbs - 12.0 lbs = 1.8 lbs. Convert to ounces: 1.8 lbs × 16 oz/lb = 28.8 oz. Time interval: 1 month = approximately 30 days. Growth velocity: 28.8 oz ÷ 30 days = 0.96 oz/day.
Normal growth velocity for 2-3 month old babies is 4-6 oz per week, which equals 0.57-0.86 oz per day. The baby's growth velocity of 0.96 oz/day is slightly above the normal range but still considered acceptable. Growth velocity is important in pediatric care as it reflects recent nutritional intake and overall health status. Sudden changes in growth velocity can indicate feeding issues, illness, or other health concerns.
Growth velocity measures the rate of growth over a specific time period, providing insight into recent nutritional status and health. Unlike percentiles which show where a child stands compared to peers, velocity shows the dynamic process of growth. Healthcare providers monitor both to get a complete picture of a child's development.
Growth Velocity: Rate of growth over time, typically measured in weight gain per day
Normal Range: Standardized growth parameters for specific age groups
Dynamic Growth: Ongoing growth process as opposed to static measurements
• Normal weight gain is 5-7 oz per week for 0-3 months
• Growth velocity should be calculated over meaningful time intervals
• Both percentiles and velocity matter for comprehensive growth assessment
• Convert pounds to ounces for easier calculation (1 lb = 16 oz)
• Average 30 days per month for growth calculations
• Monitor velocity over multiple periods to identify trends
• Calculating velocity over too short a time period to be meaningful
• Not converting units consistently (mixing pounds and ounces)
• Focusing only on percentiles while ignoring growth velocity
Pediatric Q&A
Q: My baby is in the 15th percentile for weight but has been consistently following this curve since birth. Should I be concerned?
A: If your baby has been consistently following the 15th percentile curve since birth and is otherwise healthy, active, and developing normally, there's generally no cause for concern. The key is consistency in growth pattern.
Percentiles are descriptive, not prescriptive. A baby in the 15th percentile is perfectly healthy as long as they're growing consistently. Concern arises when there's a significant deviation from their established growth pattern, such as dropping from the 50th to 15th percentile, or when growth velocity is inadequate.
Q: How often should I measure my baby's growth at home?
A: For routine monitoring, weighing and measuring once a week is sufficient for most babies under 6 months. More frequent measurements (daily) might be recommended if there are specific concerns about growth or feeding issues.
However, remember that day-to-day fluctuations are normal due to feeding, hydration, and other factors. The important thing is to look for overall trends over time. Always use the same scale and measuring technique for consistency, and share your records with your pediatrician during regular visits.