Battery Life Calculator
Device power optimization • 2026 edition
Battery Life Formula:
Show Calculator\( T = \frac{C \times V \times \eta}{P_{total}} \)
Where:
- \( T \) = Battery life (hours)
- \( C \) = Battery capacity (mAh)
- \( V \) = Voltage (V)
- \( \eta \) = Efficiency factor (0.8-0.95)
- \( P_{total} \) = Total power consumption (mW)
This formula calculates the theoretical battery life based on capacity, voltage, and total power consumption. The efficiency factor accounts for power losses in the device's circuitry and battery discharge characteristics.
Example: For a 3000 mAh battery at 3.7V with 90% efficiency (\( \eta = 0.9 \)) powering a device consuming 1500 mW:
\( T = \frac{3000 \times 3.7 \times 0.9}{1500} = \frac{9990}{1500} = 6.66 \) hours
Therefore, the battery life would be approximately 6.66 hours.
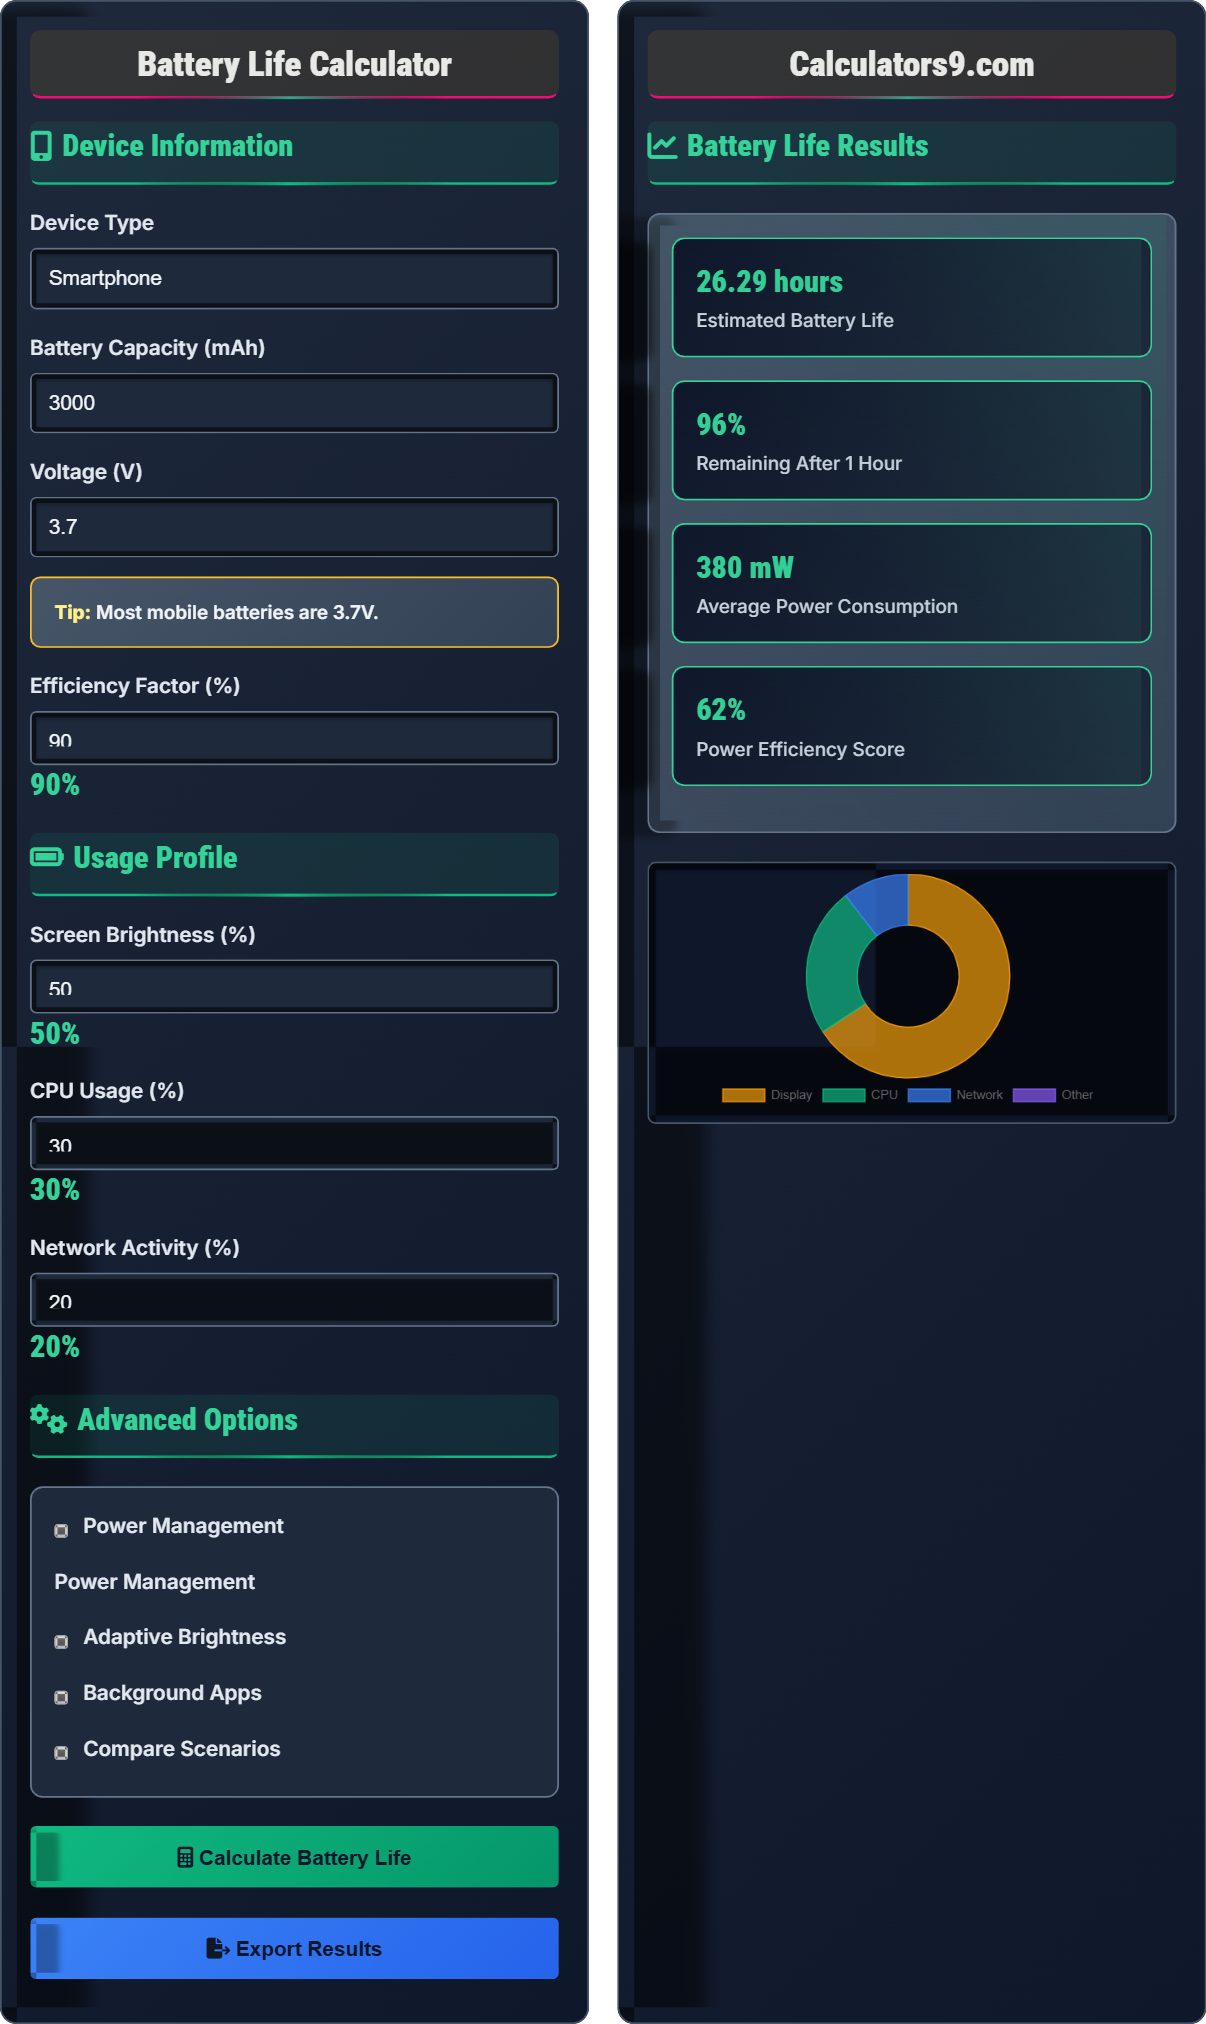
Device Information
Usage Profile
Advanced Options
Battery Life Results
| Component | Power (mW) | % of Total | Impact |
|---|
| Optimization | Benefit | Implementation |
|---|
Battery Life Guide
Battery life refers to the duration a battery-powered device can operate before needing recharging. It depends on the battery's capacity, voltage, and the device's power consumption patterns. Understanding battery life helps optimize device usage and manage expectations for portable electronics.
The battery life is calculated using the following formula:
Where:
- \(T\) = Battery life (hours)
- \(C\) = Battery capacity (mAh)
- \(V\) = Voltage (V)
- \(\eta\) = Efficiency factor (0.8-0.95)
- \(P_{total}\) = Total power consumption (mW)
Power consumption varies significantly by component:
- Display: 30-60% of total power consumption
- Processor: 20-30% of total power consumption
- Network: 10-25% of total power consumption
- Audio/Video: 5-15% of total power consumption
- Background: 5-20% of total power consumption
- Reduce Screen Brightness: Lower to comfortable minimum
- Enable Power Saving Modes: Automatically optimizes settings
- Limit Background Apps: Close unnecessary processes
- Use Wi-Fi Over Cellular: Generally more power-efficient
- Update Software: Improves power management algorithms
Battery Life Quiz
Which component typically consumes the most power in a mobile device?
The answer is B) Display. The display typically consumes 30-60% of total power in mobile devices, making it the largest power consumer. Reducing screen brightness or timeout can significantly extend battery life.
Understanding power consumption distribution helps prioritize optimization efforts. While processors are important, the display's continuous operation makes it the dominant power consumer. This knowledge guides effective battery conservation strategies.
Power Consumption: Rate at which energy is used by a device
Milliwatt (mW): Unit of power equal to one-thousandth of a watt
Milliamp-hour (mAh): Unit of electric charge commonly used to describe battery capacity
• Display is typically the largest power consumer in mobile devices
• Power consumption varies based on usage patterns
• Optimizing high-consumption components yields best results
• Reduce screen brightness to save battery life
• Use adaptive brightness settings
• Focusing optimization efforts on low-consumption components
• Assuming all components consume equal power
Calculate the battery life for a device with a 4000 mAh battery at 3.7V with 85% efficiency and total power consumption of 2000 mW. Show your work.
Using the formula: \(T = \frac{C \times V \times \eta}{P_{total}}\)
Given:
- \(C\) = 4000 mAh
- \(V\) = 3.7 V
- \(\eta\) = 0.85 (85% efficiency)
- \(P_{total}\) = 2000 mW
Calculation: \(T = \frac{4000 \times 3.7 \times 0.85}{2000} = \frac{12580}{2000} = 6.29\) hours
Therefore, the battery life would be approximately 6.29 hours.
This calculation demonstrates how battery capacity, voltage, and efficiency combine to determine operational time. The efficiency factor accounts for power losses in the system, making the theoretical capacity less than the actual available power.
Battery Capacity: Amount of charge a battery can store
Voltage: Electrical potential difference across battery terminals
Efficiency Factor: Ratio of usable energy to stored energy
• Always include efficiency factor in calculations
• Units must be consistent (mAh, V, mW)
• Result is in hours
• Remember: larger capacity = longer battery life
• Lower power consumption = longer battery life
• Forgetting to include efficiency factor
• Using inconsistent units in calculation
A laptop with a 5000 mAh battery at 11.1V has a power consumption of 2500 mW. If power management reduces consumption by 30%, calculate the new battery life and the improvement percentage.
Step 1: Calculate original battery life
\(T_{original} = \frac{5000 \times 11.1 \times 0.9}{2500} = \frac{49950}{2500} = 19.98\) hours
Step 2: Calculate new power consumption after 30% reduction
\(P_{new} = 2500 \times (1 - 0.30) = 2500 \times 0.70 = 1750\) mW
Step 3: Calculate new battery life
\(T_{new} = \frac{5000 \times 11.1 \times 0.9}{1750} = \frac{49950}{1750} = 28.54\) hours
Step 4: Calculate improvement percentage
\(\text{Improvement} = \frac{28.54 - 19.98}{19.98} \times 100 = 42.8\%\)
Therefore, the new battery life is 28.54 hours, representing a 42.8% improvement.
This example shows the non-linear relationship between power reduction and battery life extension. A 30% reduction in power consumption results in a 42.8% increase in battery life, demonstrating the exponential benefit of power optimization.
Power Management: Techniques to reduce energy consumption
Power Reduction: Decreasing energy usage through optimization
Efficiency Gain: Increased performance per unit of energy
• Power reduction has exponential benefit on battery life
• Efficiency improvements compound over time
• Small power savings can yield significant battery life gains
• Focus on components with highest power consumption
• Power reduction is more effective than capacity increase
• Assuming linear relationship between power and battery life
• Not accounting for efficiency factors
A smartphone's total power consumption is 1200 mW, with the display consuming 400 mW (33%), processor 300 mW (25%), network 200 mW (17%), and other components 300 mW (25%). If reducing screen brightness cuts display power by 50%, calculate the new total consumption and battery life improvement.
Step 1: Calculate new display power consumption
\(P_{display\_new} = 400 \times 0.50 = 200\) mW
Step 2: Calculate new total power consumption
\(P_{total\_new} = 200 + 300 + 200 + 300 = 1000\) mW
Step 3: Calculate original and new battery life (assuming 3000 mAh, 3.7V, 90% efficiency)
Original: \(T_{original} = \frac{3000 \times 3.7 \times 0.9}{1200} = \frac{9990}{1200} = 8.325\) hours
New: \(T_{new} = \frac{3000 \times 3.7 \times 0.9}{1000} = \frac{9990}{1000} = 9.99\) hours
Step 4: Calculate improvement percentage
\(\text{Improvement} = \frac{9.99 - 8.325}{8.325} \times 100 = 20\%\)
Therefore, reducing screen brightness by 50% increases battery life by 20%.
This demonstrates the impact of optimizing high-consumption components. Since the display consumed 33% of total power, reducing its consumption by 50% (from 400 to 200 mW) reduces total consumption by 16.7% (from 1200 to 1000 mW), resulting in a 20% increase in battery life.
Component Power: Power consumed by individual device parts
Power Distribution: How power is allocated among components
Optimization Priority: Order of components to optimize for best results
• Optimize highest-consumption components first
• Component power reductions directly affect total consumption
• Proportional improvements depend on original component share
• Analyze power distribution before optimizing
• Focus on components with highest % of total consumption
• Optimizing low-consumption components first
• Not considering component power distribution
How does battery degradation affect battery life over time?
The answer is B) Gradually reduces capacity and life. Lithium-ion batteries degrade over time and cycles, losing 10-20% of their capacity per year after the first few years. This degradation is irreversible and directly reduces the available energy for device operation.
Battery degradation follows predictable patterns based on chemistry and usage. Understanding this helps set realistic expectations for device performance over time. The degradation affects the capacity (C) term in our battery life formula, directly reducing the numerator and thus the overall battery life.
Battery Degradation: Loss of capacity over time and usage cycles
Cycle Life: Number of charge/discharge cycles before capacity loss
Capacity Fade: Gradual reduction in maximum charge storage
• Battery degradation is irreversible
• Capacity loss affects battery life proportionally
• Proper care can slow degradation
• Keep batteries at moderate temperatures
• Avoid full charge/discharge cycles when possible
• Assuming battery capacity remains constant over time
• Not accounting for degradation in long-term planning
Battery Life Basics
Duration a battery-powered device operates before requiring recharge.
\(T = \frac{C \times V \times \eta}{P_{total}}\)
Where T=battery life, C=capacity, V=voltage, η=efficiency, P=power consumption.
- Larger capacity = longer battery life
- Lower consumption = longer battery life
- Efficiency affects available power
Optimization Strategies
Components ranked by power consumption: Display, CPU, Network, Audio/Video.
- Reduce screen brightness
- Enable power saving modes
- Limit background apps
- Use Wi-Fi over cellular
- Temperature affects performance
- Battery degrades over time
- Usage patterns vary significantly
- Software optimizations help
FAQ
Q: How accurate are battery life calculations?
A: Battery life calculations provide good estimates using the formula \( T = \frac{C \times V \times \eta}{P_{total}} \). Where \( T \) is battery life, \( C \) is capacity, \( V \) is voltage, \( \eta \) is efficiency, and \( P_{total} \) is power consumption.
For example, with a 3000 mAh battery at 3.7V with 90% efficiency (\( \eta = 0.9 \)) and consumption of 1500 mW:
\( T = \frac{3000 \times 3.7 \times 0.9}{1500} = \frac{9990}{1500} = 6.66 \) hours
Actual results may vary due to usage patterns, temperature, aging, and software inefficiencies. However, calculations provide valuable baselines for optimization.
Q: What affects battery life most in mobile apps?
A: Mobile app power consumption is dominated by:
- Display: 30-60% of total power (screen brightness, refresh rate)
- CPU/GPU: 20-30% (processing intensity, graphics rendering)
- Network: 10-25% (data transmission, connectivity)
- Background: 5-20% (services, notifications)
For example, an app that keeps the screen on at 100% brightness uses about 3 times more power than one that dims to 30%. Similarly, intensive processing can consume 5-10 times more power than idle operations.
Optimizing these areas can significantly extend battery life for users.