Growth Chart Calculator
Pediatric growth tracker • Height & weight percentiles
CDC Growth Percentile Calculation:
Show CalculatorGrowth percentiles compare a child's measurements to standardized reference populations:
\( Percentile = \frac{Rank\_of\_Measurement}{Total\_Sample\_Size} \times 100 \)
Standard percentiles: 3rd, 5th, 15th, 25th, 50th, 75th, 85th, 95th, 97th
WHO Standards: Birth to 24 months (breastfed infants)
CDC Charts: 2 to 19 years (mixed feeding patterns)
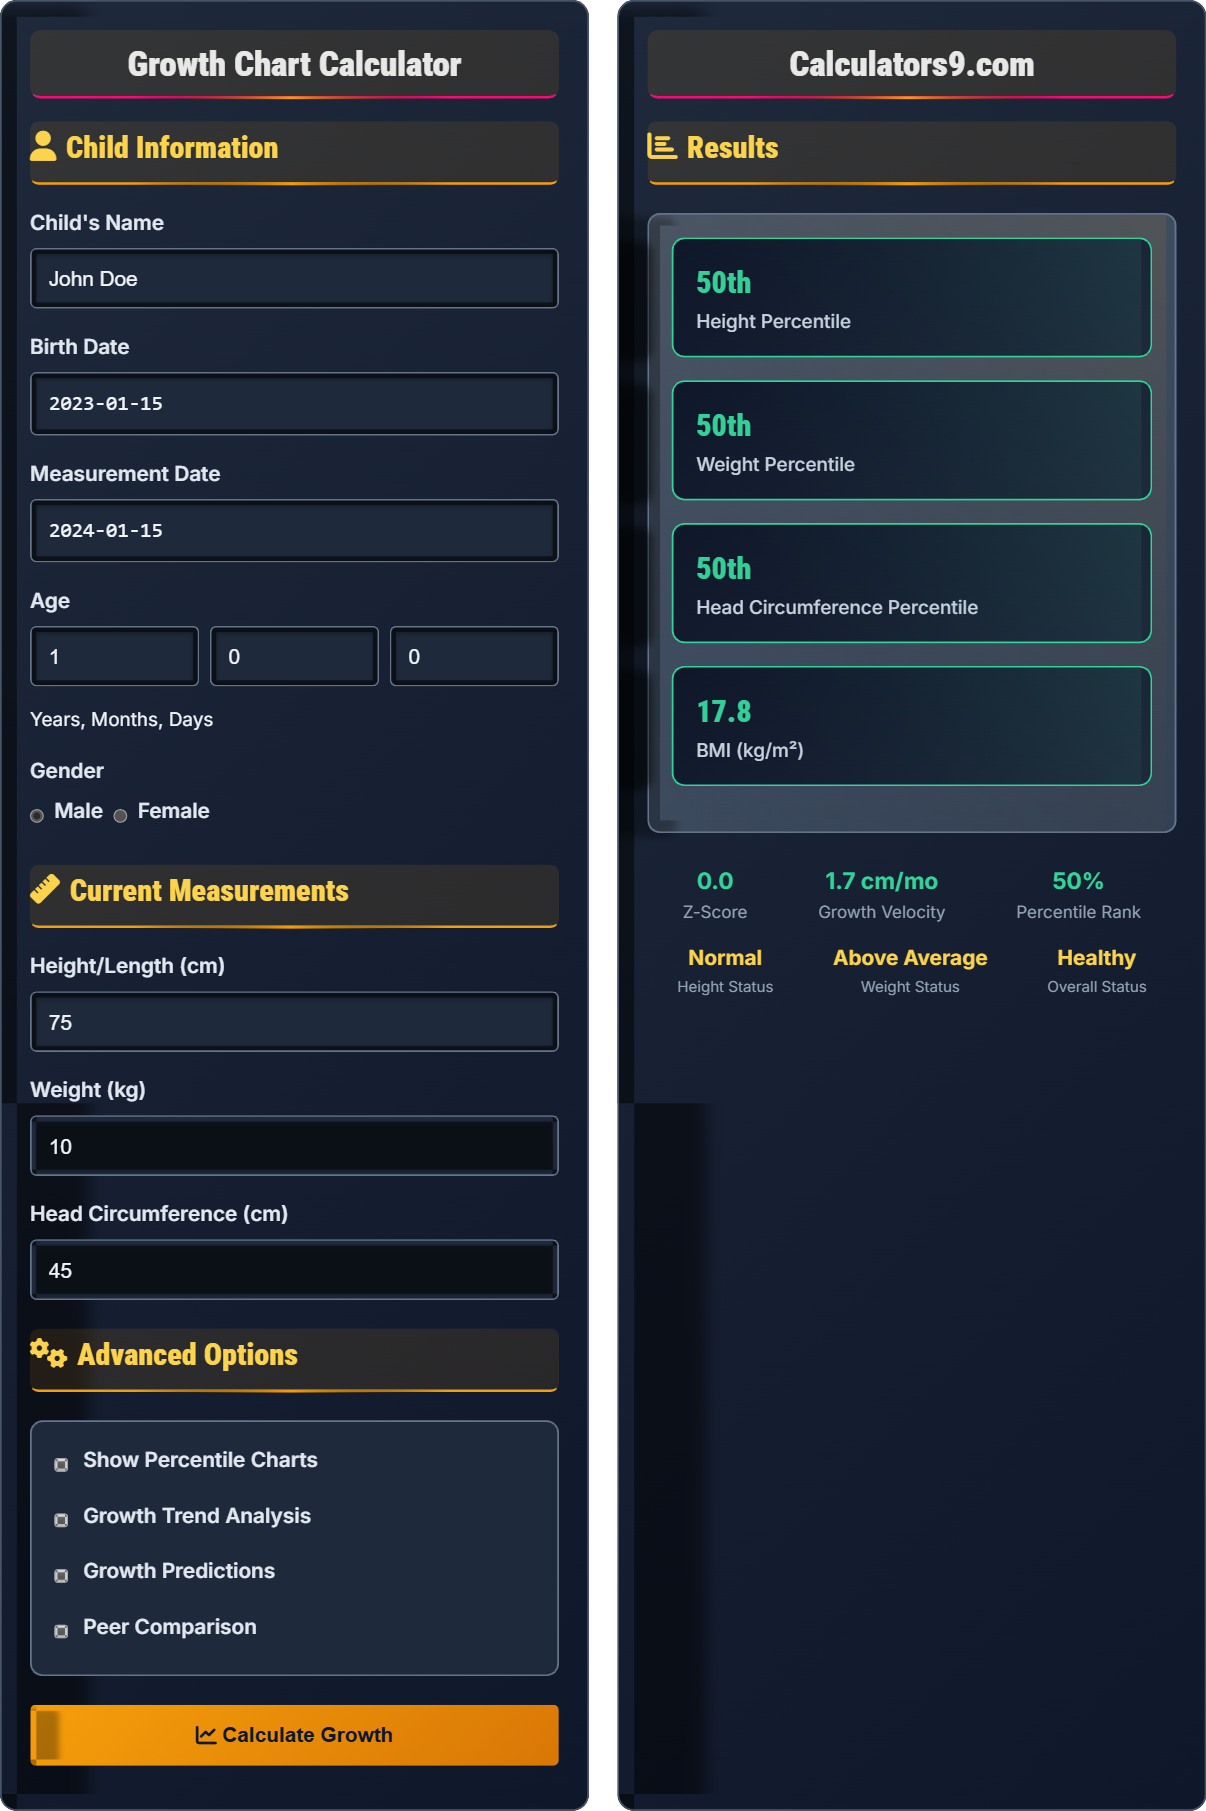
Example: 12-month-old boy, 75 cm height, 10 kg weight:
Height: 50th percentile (average)
Weight: 75th percentile (above average)
Consistent tracking along similar percentiles indicates healthy growth patterns.
Child Information
Current Measurements
Advanced Options
Results
Growth Chart Fundamentals
Growth charts are tools used to track and evaluate a child's physical growth over time. They compare a child's measurements (height, weight, head circumference) to standardized reference populations of children of the same age and sex.
Percentiles indicate where a child's measurements fall compared to reference populations:
- 5th percentile: 5% of children are smaller
- 50th percentile: Average size
- 95th percentile: 5% of children are larger
- WHO: Birth to 24 months (breastfed infants)
- CDC: 2 to 19 years (mixed feeding patterns)
- Smooth transition between charts
Clinical Applications
Healthy growth is characterized by consistent tracking along similar percentiles. Crossing percentile lines may indicate growth concerns that require further evaluation.
Important measurements for pediatric growth assessment:
- Height/length for age
- Weight for age
- Weight for height
- Head circumference (0-36 months)
- Measure regularly at well-child visits
- Plot on appropriate charts
- Look for consistent patterns
- Refer for significant deviations
Growth Chart Learning Quiz
A 2-year-old girl measures 85 cm tall and weighs 12 kg. According to CDC growth charts, she plots at the 50th percentile for height and 75th percentile for weight. Interpret these percentiles and explain their clinical significance.
Height (50th percentile):
- The child is average height for her age
- 50% of girls her age are taller, 50% are shorter
- This represents healthy, expected growth
Weight (75th percentile):
- The child weighs more than 75% of girls her age
- 25% of girls her age weigh more than she does
- This is above average but still within normal limits
Clinical Significance:
The child has a proportionate growth pattern with height appropriate for age and weight slightly above average. This combination is generally healthy but should be monitored for trends over time.
Percentiles provide a standardized way to compare a child's growth to reference populations. The 50th percentile represents the median, while other percentiles indicate relative position.
It's important to look at growth patterns over time rather than isolated measurements. A child consistently growing along the 75th percentile is healthy, even though they're above average.
Weight-for-height percentiles help assess whether a child's weight is appropriate for their height, which is important for identifying growth patterns.
Percentile: Position relative to reference population
Z-score: Standard deviation from mean (normal: -2 to +2)
Growth Velocity: Rate of growth over time
• Consistent patterns are more important than single measurements
• Use appropriate charts for age and sex
• Plot measurements regularly
• Consider family history and ethnicity
• Always plot height and weight together
• Look for crossing of percentile lines
• Consider head circumference in first 3 years
• Interpreting single measurements without trend analysis
• Using wrong growth charts for age
• Not considering biological variation
• Overreacting to minor percentile variations
A 6-month-old infant has been tracked on growth charts showing height at the 25th percentile and weight at the 50th percentile. At the current visit, height is still at the 25th percentile but weight has risen to the 90th percentile. How would you interpret this growth pattern and what recommendations would you make?
Growth Pattern Analysis:
- Height: Consistent at 25th percentile (stable)
- Weight: Rose from 50th to 90th percentile (significant increase)
- Weight-for-height: Increased from average to above average
Interpretation:
The infant is experiencing disproportionate weight gain relative to height. While height growth has remained consistent, weight gain has accelerated significantly, crossing two major percentile lines (50th to 90th).
Recommendations:
- Assess feeding practices and dietary intake
- Review recent changes in feeding patterns
- Monitor for continued rapid weight gain
- Educate parents on appropriate feeding practices
- Continue regular growth monitoring
This scenario demonstrates the importance of trend analysis in growth assessment. A child who crosses percentile lines, especially upward, warrants closer evaluation.
The stable height percentile suggests normal growth velocity, but the rapid weight gain indicates a potential issue with energy balance. This could be due to overfeeding, changes in feeding practices, or other factors.
Early intervention during infancy is important because growth patterns established in early life can persist into childhood and adulthood.
Proportional Growth: Height and weight following similar percentiles
Disproportionate Growth: Height and weight diverging
Crossing Percentiles: Moving significantly up or down growth curves
• Crossings of 2+ percentile lines warrant evaluation
• Disproportionate growth needs attention
• Consider feeding practices in rapid weight gain
• Monitor trends rather than single measurements
• Always plot measurements immediately after taking them
• Compare to previous measurements for trends
• Consider family patterns and genetics
• Not recognizing significant percentile crossings
• Focusing only on absolute measurements
• Not considering feeding practices in weight changes
• Delaying intervention in concerning patterns
Pediatric FAQ
Q: My child is in the 10th percentile for height. Should I be worried?
A: Being in the 10th percentile for height is not necessarily cause for concern:
Normal Variations:
- 10% of children are naturally shorter
- Genetics play a significant role
- Some children are constitutionally small
What to Monitor:
- Is the child consistently following their growth curve?
- Are they growing at an appropriate rate?
- Is their weight appropriate for their height?
- Do they have normal developmental milestones?
When to Concern:
- Crossing percentile lines downward
- Sudden deceleration in growth
- Significantly below parental heights
- Other symptoms present
If your child is growing consistently along the 10th percentile, they are likely healthy. However, discuss with your pediatrician for proper evaluation.
Q: How do I transition from WHO to CDC growth charts?
A: The transition from WHO to CDC growth charts occurs at 24 months:
Transition Process:
- Continue using WHO charts until 24 months
- Begin using CDC charts at 24 months
- Plot the same measurements on both charts
- Note any percentile shifts during transition
Expected Changes:
- Weight percentiles may shift downward
- Height percentiles typically remain similar
- This is normal due to different reference populations
Monitoring:
- Track the transition carefully
- Ensure smooth continuation of growth patterns
- Explain changes to parents
The WHO charts reflect growth patterns of breastfed infants, while CDC charts reflect mixed feeding patterns. The transition is planned to maintain continuity of care.