Pediatric Growth Percentile Calculator
BMI calculator for children • Age-specific percentiles
Pediatric BMI Formula:
Show the calculator\( BMI = \frac{Weight\ (kg)}{Height^2\ (m^2)} \)
For pediatric BMI percentiles, the CDC uses age- and sex-specific growth charts to determine percentiles. Unlike adult BMI categories, pediatric BMI percentiles account for growth patterns:
- Underweight: Below 5th percentile
- Healthy weight: 5th to 84th percentile
- Overweight: 85th to 94th percentile
- Obese: 95th percentile or above
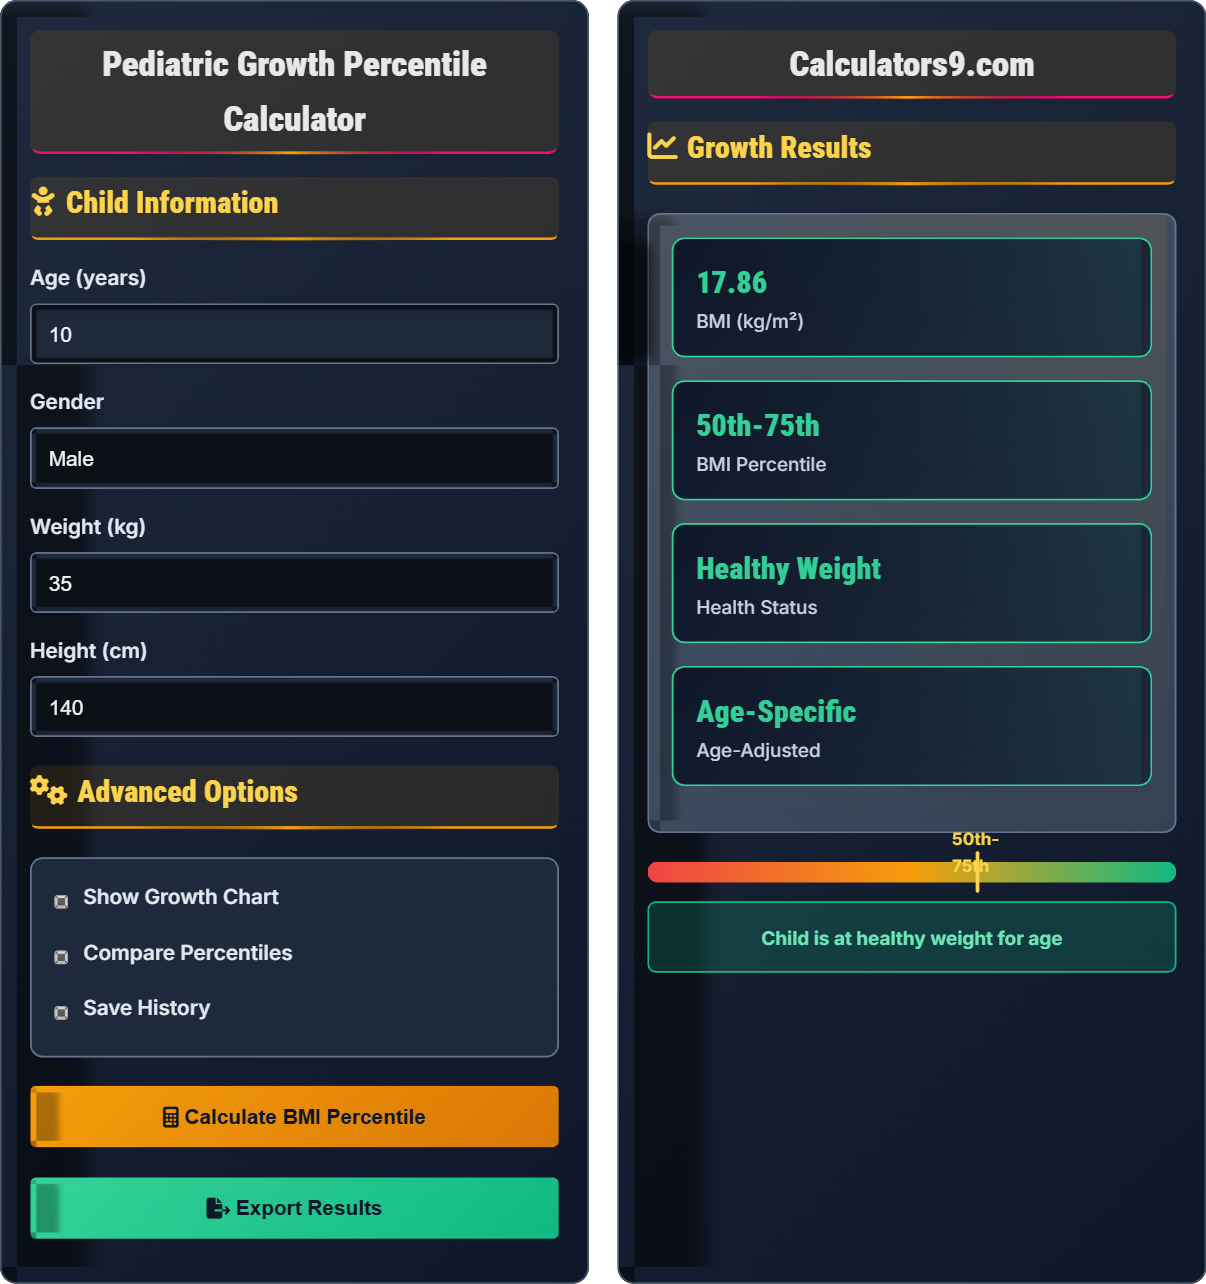
Example: For a 10-year-old boy weighing 35 kg and measuring 1.4 m tall:
BMI = 35 / (1.4)² = 35 / 1.96 ≈ 17.86 kg/m²
According to CDC charts, this BMI at age 10 places the child at approximately the 75th percentile, indicating healthy weight.
Child Information
Advanced Options
Growth Results
| Percentile | Range | Status |
|---|---|---|
| < 5th | BMI < 14.2 | Underweight |
| 5th - 84th | 14.2 - 18.5 | Healthy |
| 85th - 94th | 18.6 - 22.1 | Overweight |
| ≥ 95th | ≥ 22.2 | Obese |
| Category | Percentile Range | Health Risk |
|---|---|---|
| Underweight | < 5th | Increased risk of malnutrition |
| Healthy Weight | 5th - 84th | Optimal health outcomes |
| Overweight | 85th - 94th | Increased chronic disease risk |
| Obese | ≥ 95th | High chronic disease risk |
Pediatric Growth & BMI Guide
Pediatric BMI differs significantly from adult BMI measurements. Instead of fixed categories, pediatric BMI uses age- and sex-specific percentiles based on CDC growth charts. These percentiles account for normal growth patterns during childhood and adolescence, making interpretation more nuanced than adult BMI classifications.
The formula for BMI remains the same:
However, interpretation varies by age and sex. The CDC provides growth charts that plot BMI percentiles against age-specific norms, accounting for the changing body composition during growth phases.
Key considerations for interpreting pediatric BMI:
- Percentiles change with age as children grow
- Sex-specific charts account for different growth patterns
- Puberty affects BMI patterns differently in boys and girls
- Tracking trends over time is more valuable than single measurements
- Consider family history and overall health in context
- Screening: Identify children at risk for weight-related health issues
- Monitoring: Track growth patterns over time
- Intervention: Guide lifestyle recommendations
- Referral: Determine need for specialist consultation
- Research: Population-level health assessments
Pediatric BMI Basics
Age- and sex-specific BMI measurement for children 2-20 years.
\(BMI = \frac{Weight\ (kg)}{Height^2\ (m^2)}\)
Interpreted using CDC growth percentiles.
- Percentiles change with age
- Different charts for boys/girls
- Track trends over time
Interpretation
Underweight (<5th), Healthy (5th-84th), Overweight (85th-94th), Obese (≥95th).
- Calculate BMI
- Find appropriate percentile
- Assess trend over time
- Consider clinical context
- Puberty affects BMI patterns
- Family history matters
- Lifestyle factors important
- Medical conditions possible
Pediatric BMI Learning Quiz
According to CDC guidelines, which BMI percentile range indicates a healthy weight for a child?
The answer is B) 5th to 84th percentile. According to CDC guidelines, children with BMI percentiles between the 5th and 84th percentiles are considered to be in the healthy weight range. This range represents the middle 79% of the population distribution for age and sex.
Understanding pediatric BMI percentiles is crucial because unlike adults who have fixed BMI categories (18.5-24.9 for normal weight), children's BMI interpretation depends on age and sex-specific growth patterns. The percentile system accounts for the natural variations in body composition that occur during growth and development.
Percentile: A statistical measure indicating the percentage of individuals with lower values in a reference population
CDC Growth Charts: Standardized reference charts showing BMI percentiles for children by age and sex
Healthy Weight: BMI between 5th and 84th percentile for children
• Pediatric BMI uses percentiles, not fixed ranges
• Different charts for boys and girls
• Categories change with age
• Remember: 5th-84th = Healthy weight
• Use age-appropriate growth charts
• Track trends over multiple visits
• Applying adult BMI categories to children
• Using the wrong sex-specific chart
• Ignoring age-appropriate percentiles
Calculate the BMI for an 8-year-old girl who weighs 28 kg and measures 125 cm tall. Then interpret the percentile based on CDC standards.
Step 1: Convert height to meters: 125 cm = 1.25 m
Step 2: Calculate BMI: BMI = 28 kg / (1.25 m)² = 28 / 1.5625 = 17.92 kg/m²
Step 3: According to CDC growth charts for 8-year-old girls, a BMI of 17.92 kg/m² corresponds to approximately the 60th percentile.
Step 4: Interpretation: The 60th percentile falls within the healthy weight range (5th-84th percentile).
This problem demonstrates the multi-step process of pediatric BMI assessment. First, we calculate the raw BMI value using the standard formula. Then, we must interpret this value using age- and sex-specific growth charts. The same BMI value would have different interpretations for different ages and sexes.
BMI Formula: Weight (kg) / Height² (m²)
Growth Percentile: Position relative to age/sex reference population
Healthy Range: 5th to 84th percentile
• Always convert height to meters for calculation
• Use correct age/sex-specific charts
• Interpret percentiles in clinical context
• Double-check unit conversions
• Verify age-appropriate charts
• Consider family history in interpretation
• Forgetting to square the height
• Using incorrect conversion factors
• Misreading growth charts
A 10-year-old boy's BMI percentiles have changed from 70th to 88th over the past year. What does this pattern suggest and what might be the clinical implications?
Step 1: Analyze the percentile change - increased from 70th to 88th percentile (moved from healthy weight to overweight range)
Step 2: Interpret the pattern - crossing from 70th to 88th percentile indicates significant weight gain relative to height
Step 3: Clinical implications - child moved from healthy weight (5th-84th) to overweight category (85th-94th)
Step 4: Recommendations - evaluate dietary habits, physical activity, family history, and consider lifestyle interventions to prevent further weight gain.
This example highlights the importance of tracking growth trends over time rather than relying on single measurements. A child moving across percentile boundaries may indicate significant changes in growth patterns that warrant attention. Trend analysis is more informative than individual measurements.
Growth Trend: Pattern of BMI percentile changes over time
Clinical Significance: Meaningful change in health status
Preventive Care: Early intervention to prevent health issues
• Monitor trends over time, not single values
• Percentile crossings may indicate health changes
• Consider multiple factors in assessment
• Plot measurements on growth charts
• Look for consistent trends
• Compare to family growth patterns
• Focusing only on single measurements
• Ignoring growth trends
• Not considering family history
You're assessing a 12-year-old girl whose BMI is at the 96th percentile. She reports limited physical activity and frequent consumption of sugary drinks. What would be your priority recommendations for addressing her BMI percentile?
Step 1: Assess the situation - 96th percentile indicates obesity (≥95th percentile)
Step 2: Identify modifiable factors - limited activity and sugary drink consumption
Step 3: Develop priorities:
- Reduce sugary drink intake to occasional consumption
- Increase physical activity to at least 60 minutes daily
- Implement gradual dietary changes
- Set realistic weight management goals
- Involve family in lifestyle modifications
Step 4: Plan follow-up to monitor progress and adjust interventions.
This scenario demonstrates the clinical application of BMI assessment. When a child is in the obese category (≥95th percentile), evidence-based interventions focus on lifestyle modifications. Successful interventions involve the whole family and emphasize sustainable, gradual changes rather than restrictive approaches.
Obesity: BMI ≥95th percentile for age and sex
Lifestyle Modifications: Behavioral changes for health improvement
Evidence-Based: Interventions supported by research
• Focus on healthy behaviors, not weight loss
• Involve the whole family
• Make gradual, sustainable changes
• Start with small achievable goals
• Emphasize health over appearance
• Celebrate behavioral changes
• Prescribing restrictive diets
• Not involving family support
• Focusing on weight rather than health
Which of the following statements about pediatric BMI percentiles is TRUE?
The answer is C) A child's BMI percentile can change as they grow. Pediatric BMI percentiles are age- and sex-specific, meaning the same BMI value can represent different percentiles at different ages. As children grow, their BMI percentiles may shift due to normal developmental changes in body composition.
This concept is fundamental to understanding pediatric BMI assessment. Unlike adults who have stable BMI categories, children's BMI interpretation changes with development. During puberty, significant changes in body composition can cause percentile shifts even with stable weight and height measurements.
Age-Specific: Values vary based on chronological age
Sex-Specific: Different standards for boys and girls
Developmental Changes: Normal growth-related body composition changes
• Pediatric BMI is age-sex specific
• Percentiles can change during growth
• Puberty affects BMI patterns
• Always use age-appropriate charts
• Track changes over time
• Consider developmental stage
• Using adult BMI standards for children
• Ignoring age/sex specificity
• Not accounting for pubertal changes
FAQ
Q: My 9-year-old daughter's BMI is in the 90th percentile. What does this mean for her health?
A: A BMI at the 90th percentile for a 9-year-old indicates that your daughter weighs more than 90% of children her age and sex, placing her in the overweight category (85th-94th percentile). This suggests an increased risk for developing obesity-related health issues.
It's important to note that BMI is a screening tool, not a diagnostic test. Factors like muscle mass, bone density, and overall health should also be considered. However, the 90th percentile warrants attention to lifestyle habits.
Recommended actions include:
- Encourage balanced nutrition with fruits, vegetables, and whole grains
- Promote at least 60 minutes of daily physical activity
- Limit sugary drinks and processed foods
- Regular monitoring of growth patterns
- Consultation with a pediatric healthcare provider
Focus on healthy habits rather than weight, and involve the whole family in positive lifestyle changes.
Q: How do I explain pediatric BMI percentiles to parents who are concerned about their child's weight?
A: When explaining pediatric BMI percentiles to concerned parents, emphasize that percentiles compare their child to peers of the same age and sex, not fixed weight targets. Use positive language focusing on health rather than appearance.
Explain the categories clearly:
- Underweight: Less than 5th percentile
- Healthy weight: 5th to 84th percentile
- Overweight: 85th to 94th percentile
- Obese: 95th percentile or higher
Emphasize that percentiles can change during growth, and tracking trends over time is more important than single measurements. Focus on promoting healthy habits for the whole family rather than restrictive approaches. Address concerns with empathy and provide practical, achievable recommendations.