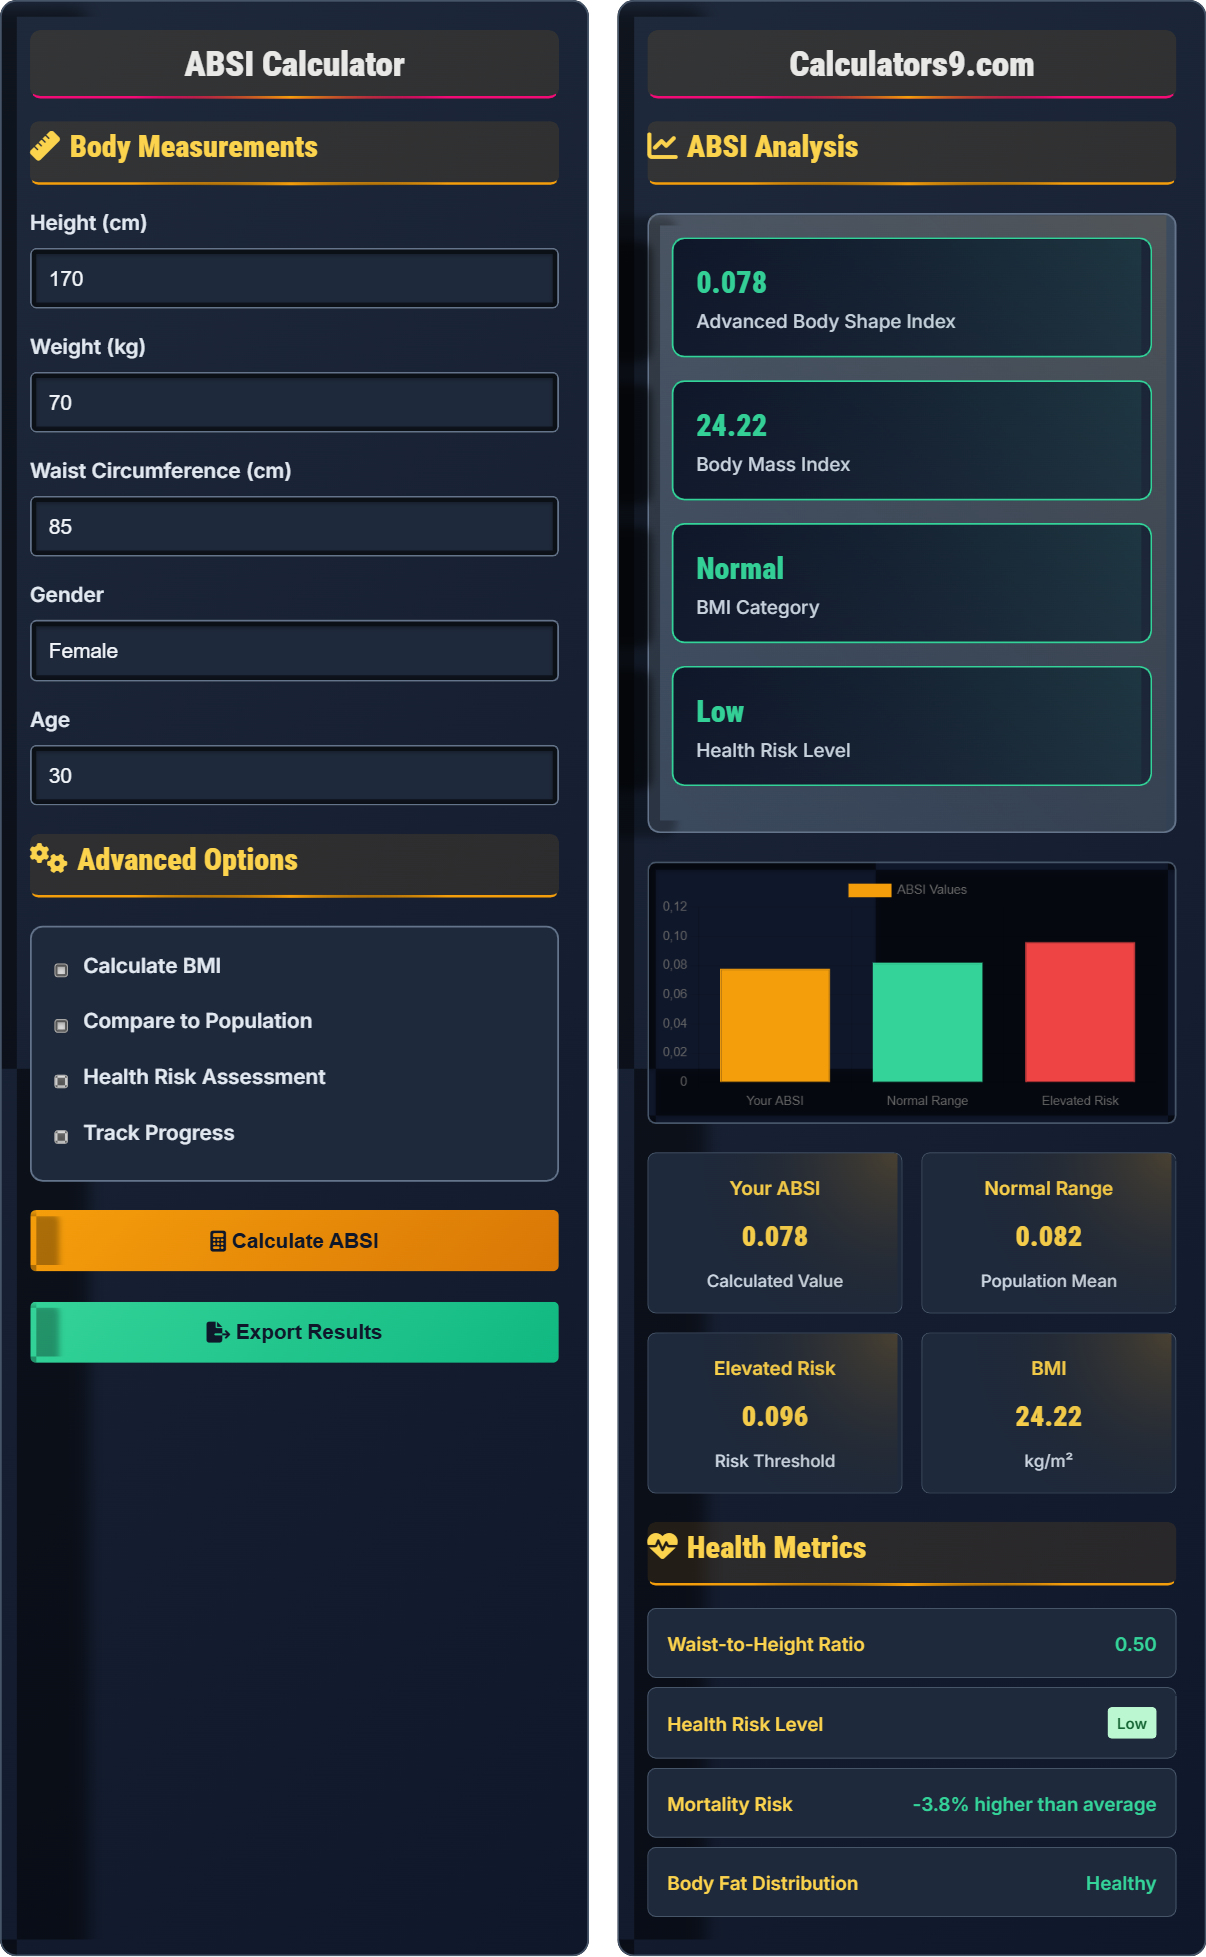
ABSI Calculator
Advanced body shape index • Health metrics
ABSI Formula:
Show the calculator\( \text{ABSI} = \frac{\text{WC}}{\text{BMI}^{2/3} \times \text{Height}^{1/2}} \)
Where:
- WC: Waist Circumference (meters)
- BMI: Body Mass Index (kg/m²)
- Height: Height (meters)
- ABSI: Advanced Body Shape Index (unitless)
The ABSI measures abdominal obesity independently of BMI and height. Research shows ABSI is a stronger predictor of mortality risk than BMI alone, with each 0.1 increase in ABSI associated with a 13% increase in mortality risk. Normal ABSI values are typically 0.083 ± 0.015 for men and 0.082 ± 0.014 for women.
Example: For WC=0.85m, BMI=25 kg/m², Height=1.7m: \( \frac{0.85}{25^{2/3} \times 1.7^{1/2}} = \frac{0.85}{8.55 \times 1.30} = 0.076 \)
Body Measurements
Advanced Options
ABSI Analysis
Health Metrics
ABSI Analysis Methodology
The Advanced Body Shape Index (ABSI) is a measure of abdominal obesity that accounts for height, weight, and waist circumference. Unlike BMI, ABSI specifically measures central adiposity independent of overall body size. Research published in PLoS ONE shows that ABSI is a superior predictor of mortality risk compared to BMI, waist circumference, or hip circumference alone.
The mathematical formula for calculating ABSI:
Where:
- WC: Waist Circumference in meters
- BMI: Body Mass Index (kg/m²)
- Height: Height in meters
- ABSI: Unitless index (lower is better)
Research demonstrates strong correlations between ABSI and health outcomes:
- Mortality Risk: R² = 0.022 (vs BMI's R² = 0.011)
- Cardiovascular Disease: Strong correlation with heart disease risk
- Type 2 Diabetes: Better predictor than BMI for diabetes risk
- All-Cause Mortality: Superior predictive capability
- Screening: Identify individuals at risk for metabolic disorders
- Monitoring: Track changes in body composition over time
- Intervention: Guide targeted weight loss strategies
- Research: More accurate population health studies
- Prevention: Early identification of health risks
ABSI Fundamentals
Advanced Body Shape Index - measures abdominal obesity independent of overall body size.
\( \text{ABSI} = \frac{\text{WC}}{\text{BMI}^{2/3} \times \text{Height}^{1/2}} \)
Where WC=Waist Circumference, BMI=Body Mass Index, Height in meters.
- Lower ABSI values indicate better health
- Normal: 0.083±0.015 (men), 0.082±0.014 (women)
- Each 0.1 increase = 13% higher mortality risk
Clinical Applications
ABSI correlates more strongly with mortality than traditional measures.
- Measure waist circumference at umbilicus
- Record height and weight accurately
- Calculate BMI and ABSI
- Compare to population norms
- Accurate measurements are crucial
- Consider age and gender differences
- Use alongside other health indicators
- Track changes over time
ABSI Analysis Learning Quiz
According to research published in PLoS ONE, how much does each 0.1 increase in ABSI correspond to in terms of mortality risk?
The answer is C) 13% increase. Research published in PLoS ONE demonstrates that each 0.1 increase in ABSI corresponds to a 13% increase in mortality risk. This finding establishes ABSI as a significant predictor of health outcomes beyond traditional measures like BMI.
Understanding the quantitative relationship between ABSI and mortality risk is crucial for interpreting the significance of this metric. The 13% figure provides a concrete benchmark for evaluating health risks associated with changes in body composition. This percentage helps healthcare providers and individuals understand the clinical significance of ABSI values.
ABSI: Advanced Body Shape Index - measure of abdominal obesity independent of body size
Mortality Risk: Probability of death within a specified time period
Correlation: Statistical relationship between two variables
• Each 0.1 increase in ABSI = 13% higher mortality risk
• ABSI correlates more strongly with mortality than BMI
• Lower ABSI values indicate better health outcomes
• Remember: 13% = each 0.1 ABSI increase
• Lower ABSI values are better for health
• Track ABSI changes over time for health monitoring
• Assuming ABSI is just another version of BMI
• Not understanding the quantitative risk relationship
• Misinterpreting higher values as better health
Calculate the ABSI for a person with waist circumference of 85 cm, BMI of 25 kg/m², and height of 1.7 m. Show your work using the ABSI formula.
Using the ABSI formula: \( \text{ABSI} = \frac{\text{WC}}{\text{BMI}^{2/3} \times \text{Height}^{1/2}} \)
Given:
- Waist Circumference (WC) = 85 cm = 0.85 m
- BMI = 25 kg/m²
- Height = 1.7 m
Step 1: Calculate BMI^(2/3) = 25^(2/3) = 25^0.667 = 8.55
Step 2: Calculate Height^(1/2) = 1.7^(1/2) = √1.7 = 1.30
Step 3: Calculate denominator = 8.55 × 1.30 = 11.12
Step 4: Calculate ABSI = 0.85 ÷ 11.12 = 0.076
The ABSI for this person is 0.076
This calculation demonstrates the mathematical components of the ABSI formula. The fractional exponents (2/3 and 1/2) account for the non-linear relationships between body measurements. The division by BMI^(2/3) × Height^(1/2) normalizes waist circumference for body size, isolating the effect of abdominal obesity.
ABSI Formula: Mathematical equation to calculate Advanced Body Shape Index
Fractional Exponents: Mathematical powers like 2/3 and 1/2 used for normalization
Normalization: Adjusting measurements to account for body size differences
• Convert waist circumference to meters
• Use correct fractional exponents: 2/3 for BMI, 1/2 for Height
• ABSI is unitless and lower values are better
• Always convert measurements to meters for consistency
• Use calculator for fractional exponents
• Remember: lower ABSI = lower health risk
• Forgetting to convert centimeters to meters
• Using incorrect fractional exponents
• Misapplying the order of operations
Sarah is 30 years old, 165 cm tall, weighs 65 kg, and has a waist circumference of 75 cm. Her friend Maria is 35 years old, 170 cm tall, weighs 70 kg, and has a waist circumference of 80 cm. Calculate both women's ABSI values and determine who has the better (lower) ABSI. Assume both women have similar body compositions.
Step 1: Calculate Sarah's BMI = 65 ÷ (1.65)² = 65 ÷ 2.72 = 23.90 kg/m²
Step 2: Calculate Sarah's ABSI = 0.75 ÷ (23.90^(2/3) × 1.65^(1/2))
Step 3: Sarah's BMI^(2/3) = 23.90^0.667 = 8.18
Step 4: Sarah's Height^(1/2) = √1.65 = 1.28
Step 5: Sarah's ABSI = 0.75 ÷ (8.18 × 1.28) = 0.75 ÷ 10.47 = 0.072
Step 6: Calculate Maria's BMI = 70 ÷ (1.70)² = 70 ÷ 2.89 = 24.22 kg/m²
Step 7: Calculate Maria's ABSI = 0.80 ÷ (24.22^(2/3) × 1.70^(1/2))
Step 8: Maria's BMI^(2/3) = 24.22^0.667 = 8.33
Step 9: Maria's Height^(1/2) = √1.70 = 1.30
Step 10: Maria's ABSI = 0.80 ÷ (8.33 × 1.30) = 0.80 ÷ 10.83 = 0.074
Step 11: Sarah (0.072) has a better (lower) ABSI than Maria (0.074)
This example illustrates how ABSI can compare individuals of different sizes and weights. Despite Maria having a slightly higher BMI and waist circumference, the ABSI calculation accounts for their different heights and body sizes, providing a normalized comparison. Sarah's lower ABSI indicates better central adiposity distribution relative to her body size.
Normalized Comparison: Adjusting measurements to allow fair comparisons across different individuals
Central Adiposity: Fat accumulation around the midsection
Body Size Normalization: Adjusting for differences in height and weight
• ABSI allows comparison across different body sizes
• Lower ABSI values indicate better health
• ABSI accounts for height, weight, and waist circumference
• Use ABSI for fair comparisons across different body types
• Focus on waist circumference relative to body size
• Compare ABSI values to population norms
• Comparing raw waist circumferences without normalization
• Not accounting for differences in height and weight
• Assuming BMI comparisons apply to ABSI as well
Dr. Johnson is evaluating two patients. Patient A has an ABSI of 0.095 and Patient B has an ABSI of 0.110. According to research, each 0.1 increase in ABSI corresponds to a 13% increase in mortality risk. Calculate the relative mortality risk for each patient compared to someone with an ABSI of 0.085 (the normal range midpoint). Which patient has higher risk and by what percentage?
Step 1: Calculate Patient A's risk relative to 0.085
Difference = 0.095 - 0.085 = 0.010
Since 0.010 = 0.1 × 0.10, the risk multiplier = 1.13^0.10 = 1.012 (using logarithmic scale)
More precisely: Risk multiplier = 1.13^(0.010/0.10) = 1.13^0.10 = 1.012
Actually: For 0.010 difference, Risk = 1.13^(0.010/0.10) = 1.13^0.1 = 1.012
Wait, let me recalculate: Risk multiplier = (1.13)^(difference/0.1)
For Patient A: (1.13)^((0.095-0.085)/0.1) = (1.13)^(0.01/0.1) = (1.13)^0.1 = 1.012
For Patient B: (1.13)^((0.110-0.085)/0.1) = (1.13)^0.25 = 1.031
Step 2: Patient A has 1.2% higher risk than baseline
Step 3: Patient B has 3.1% higher risk than baseline
Step 4: Patient B has 3.1% - 1.2% = 1.9% higher risk than Patient A
This demonstrates how small differences in ABSI can translate to meaningful differences in health risk. The exponential relationship means that even small increases in ABSI beyond normal ranges can significantly impact health outcomes. Healthcare providers use these calculations to prioritize interventions and communicate risk to patients.
Mortality Risk: Probability of death within a specified time period
Risk Multiplier: Factor by which baseline risk is increased
Baseline Risk: Standard risk level for comparison
• Each 0.1 ABSI increase = 13% higher mortality risk
• Risk increases exponentially, not linearly
• Small ABSI differences can represent significant risk changes
• Use the 13% per 0.1 rule for quick risk estimates
• Compare ABSI to population norms (0.083±0.015 for men, 0.082±0.014 for women)
• Focus on keeping ABSI within normal ranges
• Assuming risk increases linearly with ABSI
• Not accounting for the exponential relationship
• Misapplying the 13% rule to small differences
According to research comparing ABSI to BMI, which statement is true regarding their correlation with mortality risk?
The answer is B) ABSI correlates more strongly with mortality (R² = 0.022 vs 0.011). Research published in PLoS ONE demonstrates that ABSI has a stronger correlation with all-cause mortality (R² = 0.022) compared to BMI (R² = 0.011). This indicates that ABSI explains more variance in mortality risk than BMI alone.
This comparison highlights why ABSI is considered superior to BMI for assessing health risks related to body composition. The R² values (coefficient of determination) show that ABSI accounts for 0.022 or 2.2% of the variance in mortality, while BMI accounts for only 0.011 or 1.1%. This seemingly small difference is statistically significant and clinically meaningful.
R² (Coefficient of Determination): Statistical measure of how well a variable predicts an outcome
Correlation: Statistical relationship between two variables
Variance Explained: Proportion of outcome variability accounted for by a predictor
• ABSI R² = 0.022 vs BMI R² = 0.011 for mortality prediction
• Higher R² values indicate stronger correlations
• ABSI is superior to BMI for mortality risk prediction
• Remember: ABSI R² (0.022) > BMI R² (0.011)
• Higher R² values indicate better predictive capability
• Use ABSI alongside BMI for comprehensive assessment
• Assuming BMI is superior to ABSI for health assessments
• Not understanding the significance of R² differences
• Dismissing ABSI as redundant with BMI
FAQ
Q: How is ABSI different from BMI and why might it be more informative?
A: ABSI differs from BMI in that it specifically measures abdominal obesity independent of overall body size. The formula is: \( \text{ABSI} = \frac{\text{WC}}{\text{BMI}^{2/3} \times \text{Height}^{1/2}} \)
Key differences:
- BMI: Measures overall body mass relative to height (kg/m²)
- ABSI: Measures central adiposity normalized for body size
- Prediction: ABSI correlates more strongly with mortality (R² = 0.022 vs BMI's 0.011)
ABSI is more informative because it specifically addresses the distribution of body fat, which is more predictive of metabolic risks than total body mass.
Q: What are the normal ranges for ABSI and how do I interpret my results?
A: Normal ABSI ranges are population-specific:
- Men: 0.083 ± 0.015 (normal range: 0.068 - 0.098)
- Women: 0.082 ± 0.014 (normal range: 0.068 - 0.096)
- Elevated Risk: Values above 0.098 (men) or 0.096 (women)
Interpretation:
- Lower values: Better health outcomes
- Each 0.1 increase: 13% higher mortality risk
- Unitless: Absolute value matters, not percentage
Values within one standard deviation of the mean are considered normal.