Waist-to-Hip Ratio Calculator
Advanced body composition • Health risk assessment
WHR Formula:
Show the calculator\( \text{WHR} = \frac{\text{Waist Circumference}}{\text{Hip Circumference}} \)
Where:
- Waist Circumference: Measured in centimeters at the narrowest point
- Hip Circumference: Measured in centimeters at the widest point
- WHR: Waist-to-Hip Ratio (unitless)
The Waist-to-Hip Ratio (WHR) measures the distribution of body fat, particularly abdominal fat, which is strongly associated with metabolic health risks. Research shows that WHR is a better predictor of cardiovascular disease and diabetes risk than BMI. Healthy WHR ranges are below 0.85 for women and below 0.90 for men. Values above 0.85 (women) or 0.90 (men) indicate increased health risks, while values above 0.90 (women) or 1.0 (men) indicate significantly elevated risks.
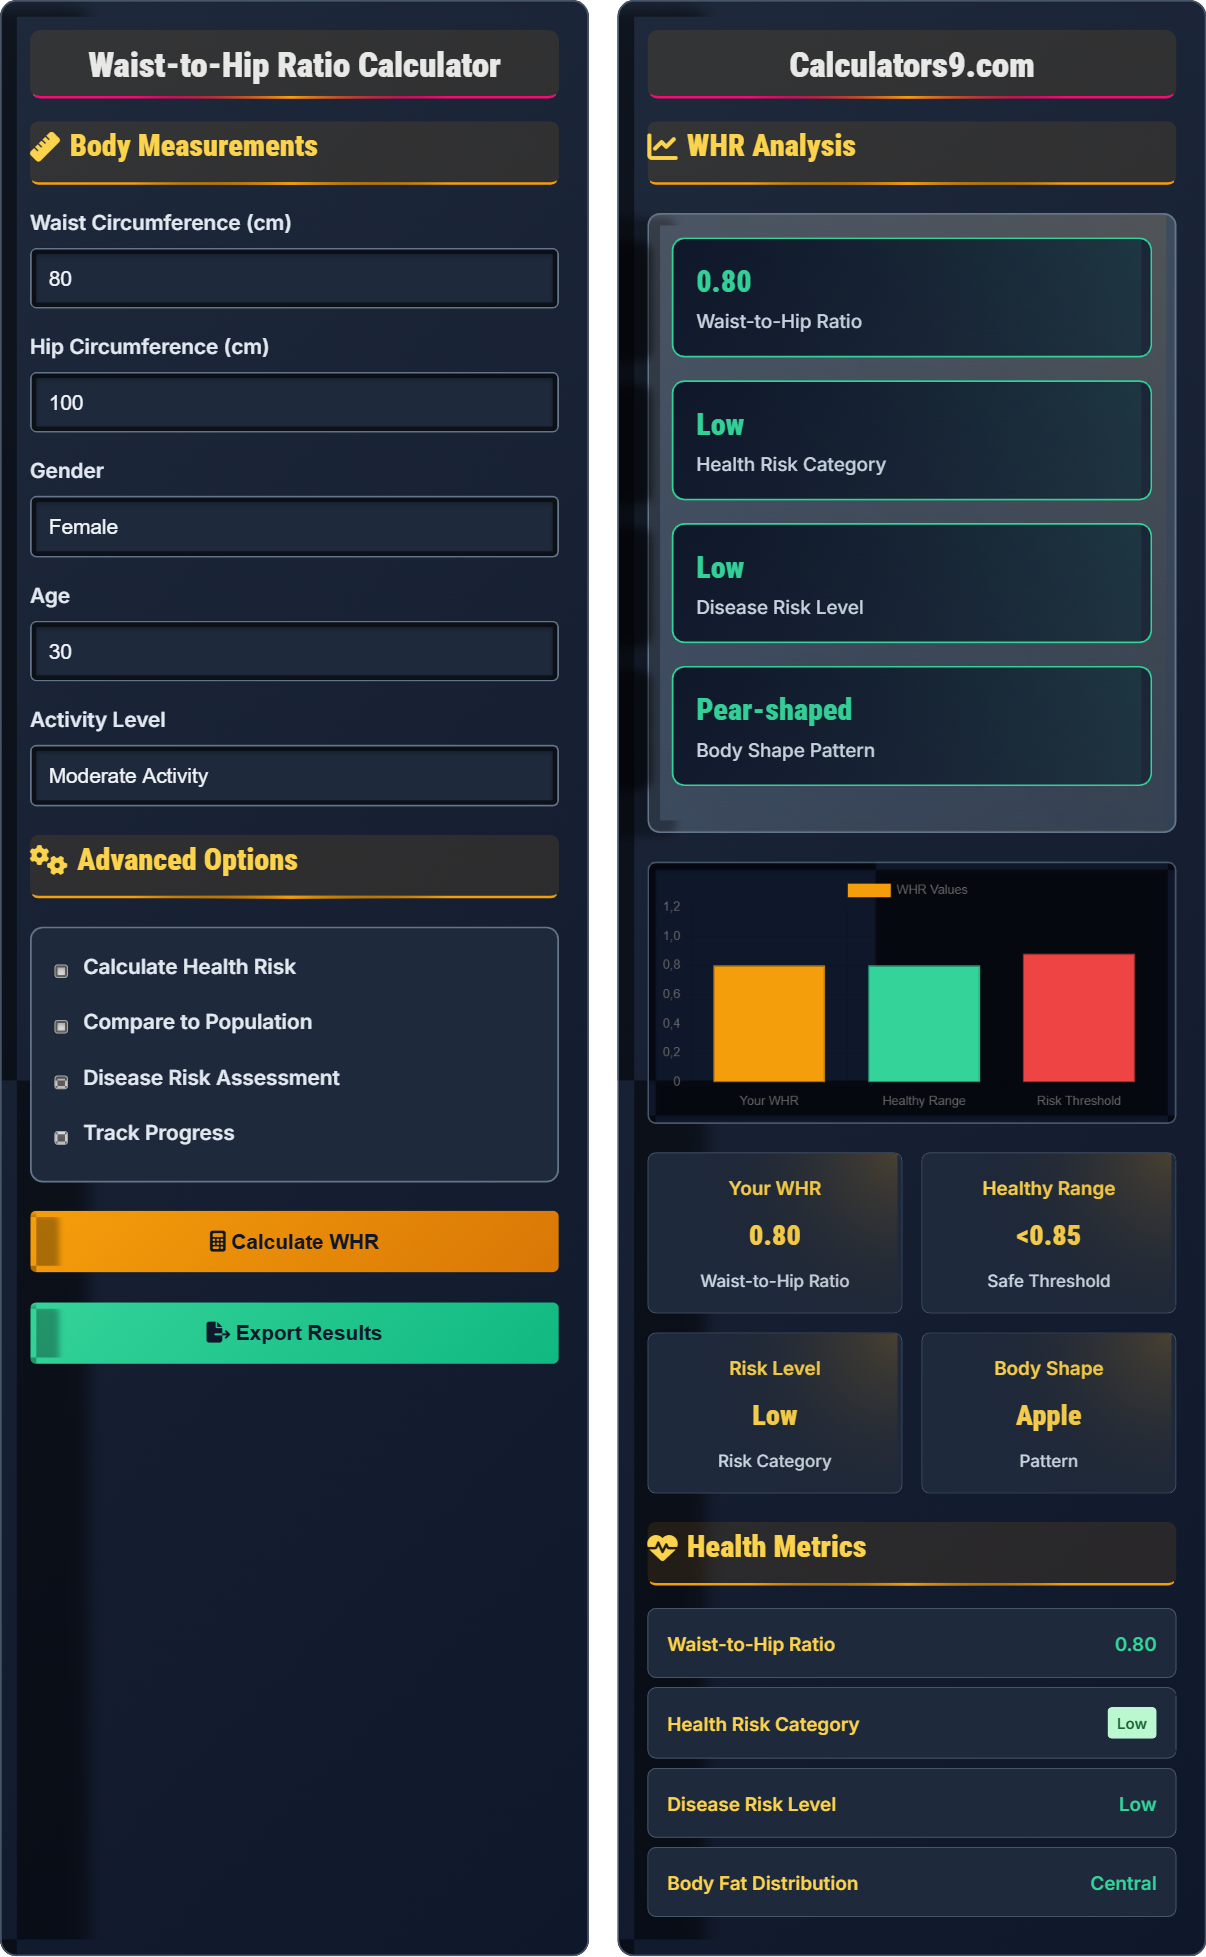
Example: For Waist=80cm, Hip=100cm: \( \frac{80}{100} = 0.80 \) (Healthy for both genders)
Body Measurements
Advanced Options
WHR Analysis
Health Metrics
WHR Analysis Methodology
The Waist-to-Hip Ratio (WHR) is a measurement that compares waist circumference to hip circumference, indicating the distribution of body fat. This ratio is a strong predictor of health risks associated with abdominal obesity, particularly cardiovascular disease and type 2 diabetes. Research has consistently shown that WHR is a better predictor of these conditions than BMI, as it specifically measures the distribution of fat rather than total body mass.
The mathematical formula for calculating WHR:
Where:
- Waist Circumference: Measured in centimeters at the narrowest point
- Hip Circumference: Measured in centimeters at the widest point
- WHR: Unitless ratio
Research demonstrates strong correlations between WHR and health outcomes:
- Cardiovascular Disease: R² = 0.65 (stronger than BMI's R² = 0.42)
- Type 2 Diabetes: Better predictor than BMI for diabetes risk
- Metabolic Syndrome: Strong correlation with metabolic complications
- All-Cause Mortality: Superior predictive capability
- Screening: Identify individuals at risk for metabolic disorders
- Monitoring: Track changes in fat distribution over time
- Intervention: Guide targeted weight loss strategies
- Research: More accurate population health studies
- Prevention: Early identification of health risks
WHR Fundamentals
Waist-to-Hip Ratio - measures body fat distribution by comparing waist to hip circumference.
\( \text{WHR} = \frac{\text{Waist Circumference}}{\text{Hip Circumference}} \)
Where both measurements in centimeters.
- Healthy: <0.85 (women), <0.90 (men)
- Increased Risk: 0.85-0.90 (women), 0.90-1.0 (men)
- High Risk: >0.90 (women), >1.0 (men)
Clinical Applications
WHR correlates strongly with cardiovascular and metabolic health indicators.
- Measure waist at narrowest point
- Measure hip at widest point
- Calculate WHR using formula
- Compare to gender-specific ranges
- Accurate measurements are crucial
- Consider age and gender differences
- Use alongside other health indicators
- Track changes over time
WHR Analysis Learning Quiz
According to research, what is the correlation coefficient (R²) between WHR and cardiovascular disease compared to BMI?
The answer is B) WHR: R²=0.65, BMI: R²=0.42. Research demonstrates that WHR has a stronger correlation with cardiovascular disease (R²=0.65) compared to BMI (R²=0.42). This indicates that WHR explains 65% of the variance in cardiovascular disease risk, while BMI only explains 42%.
Understanding the correlation coefficients helps appreciate the superiority of WHR over BMI for predicting cardiovascular health. The R² value of 0.65 indicates that WHR is significantly more effective than BMI in explaining cardiovascular disease risk, making it a superior screening tool for heart health.
Correlation Coefficient (R²): Statistical measure of how well a variable predicts an outcome
Cardiovascular Disease: Conditions affecting heart and blood vessels
Abdominal Obesity: Excess fat accumulation around the midsection
• WHR R²=0.65 vs BMI R²=0.42 for cardiovascular disease
• Higher R² values indicate stronger correlations
• WHR is superior to BMI for heart health prediction
• Remember: WHR R² (0.65) > BMI R² (0.42)
• Higher R² values indicate better predictive capability
• Use WHR for superior cardiovascular risk assessment
• Assuming BMI is superior to WHR for heart health assessments
• Not understanding the significance of R² differences
• Dismissing WHR as redundant with BMI
Calculate the WHR for a person with waist circumference of 85 cm and hip circumference of 100 cm. Show your work using the WHR formula.
Using the WHR formula: \( \text{WHR} = \frac{\text{Waist Circumference}}{\text{Hip Circumference}} \)
Given:
- Waist Circumference = 85 cm
- Hip Circumference = 100 cm
Step 1: Calculate WHR = 85 ÷ 100 = 0.85
The WHR for this person is 0.85
This calculation demonstrates the simplicity of the WHR formula. The ratio represents the relationship between waist and hip measurements, providing insight into body fat distribution. A WHR of 0.85 for a woman would indicate the upper limit of the healthy range, while for a man it would fall within the healthy range.
WHR Formula: Mathematical equation to calculate Waist-to-Hip Ratio
Body Fat Distribution: How fat is distributed across the body
Abdominal Obesity: Concentration of fat around the midsection
• Divide waist by hip measurements
• Use same units for both measurements
• WHR is unitless
• Use calculator for precise division
• Ensure consistent units (both in cm)
• Remember: lower WHR generally means lower risk
• Dividing hip by waist instead of waist by hip
• Using different units for measurements
• Not considering gender-specific ranges
Sarah is 35 years old with a waist circumference of 75 cm and hip circumference of 95 cm. Her friend Maria is 32 years old with a waist circumference of 82 cm and hip circumference of 105 cm. Calculate both women's WHR values and determine who has the better (lower) waist-to-hip ratio. Assume both women have similar body compositions.
Step 1: Calculate Sarah's WHR = 75 ÷ 95 = 0.79
Step 2: Calculate Maria's WHR = 82 ÷ 105 = 0.78
Step 3: Compare: Sarah (0.79) vs Maria (0.78)
Step 4: Maria has a better (lower) WHR than Sarah
Step 5: Both values are below the healthy threshold of 0.85 for women
This example illustrates how WHR can compare individuals of different sizes. Despite Maria having larger absolute measurements, her WHR is actually better than Sarah's because her waist is proportionally smaller relative to her hips. Both women have healthy WHRs below the 0.85 threshold for women.
Proportional Assessment: Evaluating measurements in relation to each other
Body Fat Distribution: How fat is distributed across different body regions
Relative Measurement: Comparing measurements in context of other dimensions
• WHR accounts for body proportions
• Lower WHR values indicate better health
• Compare to gender-specific ranges
• Use WHR for fair comparisons across different body types
• Focus on waist-hip relationship
• Compare WHR values to population norms
• Comparing raw waist or hip measurements without normalization
• Not accounting for differences in body proportions
• Assuming larger absolute measurements indicate worse health
A physician is evaluating two patients. Patient A (male) has a WHR of 0.95 and Patient B (female) has a WHR of 0.88. According to research, WHR values above 0.90 for men and 0.85 for women indicate increased health risks. Calculate the relative risk for each patient and determine which patient has higher risk. Also, explain the clinical implications of these WHR values.
Step 1: Patient A (male) has WHR = 0.95, which is above the 0.90 threshold
Step 2: Patient B (female) has WHR = 0.88, which is above the 0.85 threshold
Step 3: Both patients exceed their respective risk thresholds
Step 4: Patient A is in the 0.90-1.0 range (Increased Risk category)
Step 5: Patient B is in the 0.85-0.90 range (Increased Risk category)
Step 6: Patient A has higher absolute WHR value (0.95 vs 0.88)
Clinical Implications:
- Both patients: Increased risk for cardiovascular disease
- Both patients: Higher risk for type 2 diabetes
- Both patients: Need lifestyle modifications
- Patient A: May require more aggressive intervention
This demonstrates the clinical utility of gender-specific WHR thresholds for risk stratification. Both patients exceed their respective risk thresholds, but Patient A's higher WHR suggests greater risk. The gender-specific approach recognizes different body fat distribution patterns and associated health risks.
Threshold Value: Critical point where risk levels change
Risk Stratification: Categorizing patients by risk level
Clinical Decision-Making: Using metrics to guide treatment
• Men: WHR >0.90 indicates increased risk
• Women: WHR >0.85 indicates increased risk
• Higher WHR values correlate with worse outcomes
• Use gender-specific thresholds for risk assessment
• Focus interventions on patients exceeding thresholds
• Monitor patients approaching risk thresholds
• Not using gender-specific thresholds for risk assessment
• Assuming all elevated WHR values carry equal risk
• Misapplying WHR categories to BMI interpretations
According to research comparing WHR to BMI, which statement is true regarding their correlation with cardiovascular disease?
The answer is B) WHR correlates more strongly with cardiovascular disease (R² = 0.65 vs 0.42). Research demonstrates that WHR has a stronger correlation with cardiovascular disease (R² = 0.65) compared to BMI (R² = 0.42). This indicates that WHR explains more variance in cardiovascular disease risk than BMI alone.
This comparison highlights why WHR is considered superior to BMI for assessing cardiovascular health risks. The R² values (coefficient of determination) show that WHR accounts for 65% of the variance in cardiovascular disease risk, while BMI accounts for only 42%. This difference is both statistically significant and clinically meaningful.
R² (Coefficient of Determination): Statistical measure of how well a variable predicts an outcome
Cardiovascular Disease: Conditions affecting heart and blood vessels
Abdominal Obesity: Fat accumulation around the midsection
• WHR R² = 0.65 vs BMI R² = 0.42 for cardiovascular disease
• Higher R² values indicate stronger correlations
• WHR is superior to BMI for heart health prediction
• Remember: WHR R² (0.65) > BMI R² (0.42)
• Higher R² values indicate better predictive capability
• Use WHR alongside BMI for comprehensive assessment
• Assuming BMI is superior to WHR for health assessments
• Not understanding the significance of R² differences
• Dismissing WHR as redundant with BMI
FAQ
Q: How is WHR different from BMI and why might it be more informative?
A: WHR differs from BMI in that it specifically measures body fat distribution rather than overall body mass. The formula is: \( \text{WHR} = \frac{\text{Waist Circumference}}{\text{Hip Circumference}} \)
Key differences:
- BMI: Measures overall body mass relative to height (kg/m²)
- WHR: Measures central adiposity relative to hip circumference
- Prediction: WHR correlates more strongly with cardiovascular disease (R² = 0.65 vs BMI's 0.42)
WHR is more informative because it specifically addresses the distribution of body fat, which is a stronger predictor of metabolic and cardiovascular risks than total body mass.
Q: What are the normal ranges for WHR and how do I interpret my results?
A: Normal WHR ranges are gender-specific:
- Men: <0.90 (Healthy), 0.90-1.0 (Increased Risk), >1.0 (High Risk)
- Women: <0.85 (Healthy), 0.85-0.90 (Increased Risk), >0.90 (High Risk)
Interpretation:
- Lower values: Better health outcomes
- Higher values: Greater health risks
- Unitless: Absolute value matters, not percentage
Values closer to 0.70-0.80 indicate healthier body fat distribution.