Conversion Rate Calculator
CRO calculator • 2026 metrics
Conversion Rate Formulas:
Show the calculator\( Conversion Rate = \frac{\text{Conversions}}{\text{Visitors}} \times 100 \)
\( Lift = \frac{\text{Variant CR} - \text{Control CR}}{\text{Control CR}} \times 100 \)
\( Statistical Significance = \frac{(\text{Variant CR} - \text{Control CR})}{\sqrt{\frac{\text{Control CR}(1-\text{Control CR})}{\text{Control Visitors}} + \frac{\text{Variant CR}(1-\text{Variant CR})}{\text{Variant Visitors}}}} \)
\( ROI = \frac{\text{Revenue from Conversions} - \text{Campaign Cost}}{\text{Campaign Cost}} \times 100 \)
Where:
- Conversion Rate = Percentage of visitors who completed the desired action
- Lift = Percentage improvement in conversion rate
- Statistical Significance = Z-score for confidence level
- ROI = Return on investment from conversion optimization
These formulas calculate conversion metrics, A/B test results, and statistical confidence in conversion optimization efforts.
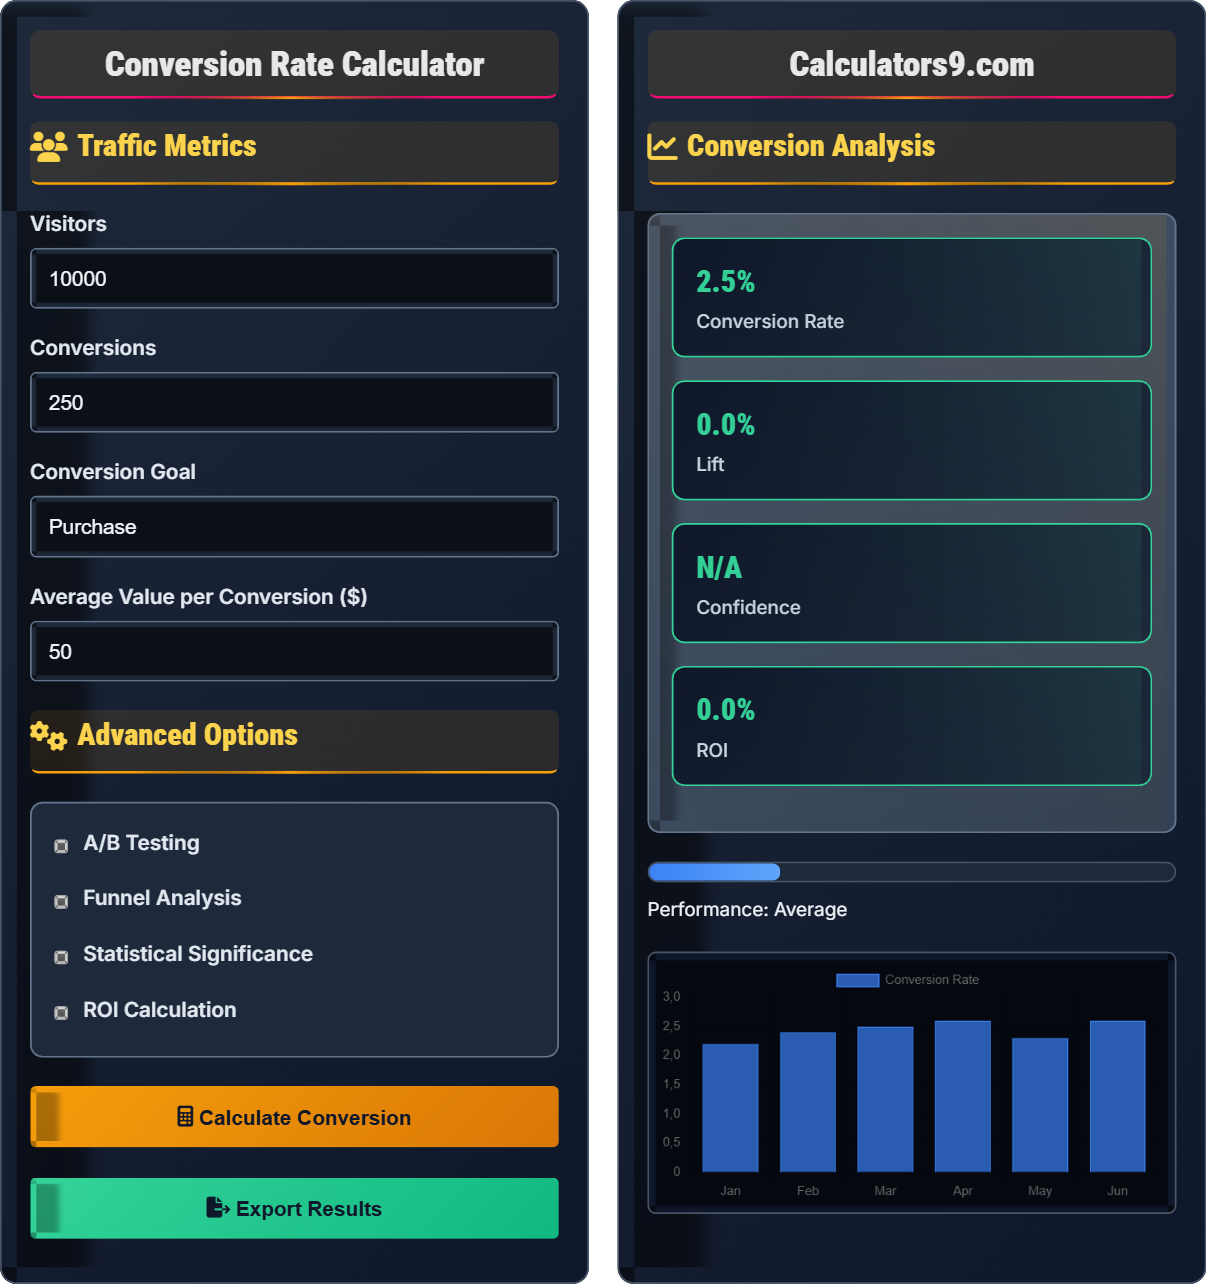
Example: For a website with 10,000 visitors and 250 conversions:
\( Conversion Rate = \frac{250}{10,000} \times 100 = 2.5\% \)
If an A/B test shows variant converts at 3.0%: Lift = \(\frac{3.0 - 2.5}{2.5} \times 100 = 20\% \)
Thus, the conversion rate is 2.5% with a 20% lift from the variant.
Traffic Metrics
Advanced Options
Conversion Analysis
Performance: Good
| Metric | Formula | Value | Industry Benchmark | Interpretation |
|---|
| Stage | Visitors | Drop-off | Conversion Rate | Improvement |
|---|
Comprehensive Conversion Rate Optimization Guide
Conversion rate is the percentage of visitors who complete a desired action on a website or landing page. It's a critical metric for measuring the effectiveness of marketing campaigns, website design, and user experience. A conversion can be a purchase, signup, download, contact form submission, or any other valuable action defined by the business. Understanding and optimizing conversion rates is essential for improving marketing ROI and business growth.
The basic conversion rate calculations use the following formulas:
Where:
- Conversions = Completed desired actions
- Visitors = Unique individuals visiting the page
- Conversion Lift = Improvement percentage in A/B tests
- Confidence Level = Statistical certainty of results
Conversion rates vary significantly across industries and channels:
- E-commerce: 2-3% average (varies by category and device)
- Lead Generation: 2-5% for forms, 10-15% for downloads
- Travel: 3-6% for booking sites
- Finance: 2-4% for applications, 5-10% for signups
- Media/Publishing: 1-3% for subscriptions
- SaaS: 2-5% for trial signups, 5-10% for demos
- Improve Page Load Speed: Every second delay can reduce conversions by 7%
- Optimize Call-to-Actions: Use contrasting colors, clear copy, and strategic placement
- Simplify Forms: Reduce fields, use smart defaults, and implement progressive disclosure
- Build Trust Signals: Include testimonials, security badges, guarantees, and social proof
- Personalize Experience: Customize content based on visitor behavior and preferences
- Mobile Optimization: Ensure seamless experience across all devices
Conversion Fundamentals
Percentage of visitors who complete a desired action.
Conversion Rate = \(\frac{\text{Conversions}}{\text{Visitors}} \times 100\)
Lift = \(\frac{\text{Variant CR} - \text{Control CR}}{\text{Control CR}} \times 100\)
- Higher conversion rates indicate better performance
- Context and industry benchmarks matter
- Statistical significance is crucial for testing
Analysis Framework
Conversion optimization focuses on turning visitors into customers.
- Measure baseline conversion rate
- Identify conversion barriers
- Formulate optimization hypotheses
- Test and validate improvements
- Sample size affects reliability
- Seasonal variations impact rates
- Quality of traffic affects conversions
Conversion Rate Learning Quiz
A website received 50,000 visitors in a month and recorded 750 conversions. What is the conversion rate?
The answer is A) 1.5%. To calculate conversion rate: Conversion Rate = (Conversions / Visitors) × 100 = (750 / 50,000) × 100 = 0.015 × 100 = 1.5%. This calculation shows that 1.5% of visitors completed the desired action during the month. The formula is straightforward: divide the number of conversions by the total number of visitors and multiply by 100 to get a percentage.
This problem demonstrates the fundamental conversion rate calculation. Students must understand that conversion rate is simply a ratio of successful outcomes to total opportunities, expressed as a percentage. The calculation is: Conversion Rate = (Successful Actions / Total Opportunities) × 100. This metric helps businesses understand the effectiveness of their marketing efforts and website design.
Conversion Rate: Percentage of visitors who complete a desired action
Conversions: Successful completion of the desired action
Visitors: Individuals who visit the page or site
• Always express as a percentage
• Higher rates indicate better performance
• Context and benchmarks provide meaning
• Multiply by 100 to convert to percentage
• Compare to industry benchmarks
• Track over time for trends
• Forgetting to multiply by 100
• Using wrong denominator
• Not considering statistical significance
Explain how to calculate statistical significance for A/B testing in conversion rate optimization, including the mathematical model and interpretation of results. Discuss the importance of sample size and confidence levels in drawing valid conclusions.
Statistical significance in A/B testing is calculated using a Z-test for proportions. The formula is: Z = (p₁ - p₂) / √[(p₁(1-p₁)/n₁) + (p₂(1-p₂)/n₂)], where p₁ and p₂ are the conversion rates for control and variant, and n₁ and n₂ are the sample sizes. For example, if control has 5,000 visitors with 100 conversions (2%) and variant has 5,000 visitors with 125 conversions (2.5%): p₁ = 0.02, p₂ = 0.025, n₁ = n₂ = 5,000. Z = (0.025 - 0.02) / √[(0.02×0.98/5000) + (0.025×0.975/5000)] = 0.005 / √[0.00000392 + 0.000004875] = 0.005 / 0.00297 = 1.68. A Z-score of 1.68 corresponds to ~95.4% confidence (p-value ≈ 0.093). For 95% confidence (α = 0.05), we need |Z| > 1.96. Since 1.68 < 1.96, the result is not statistically significant at the 95% level. Sample size affects the standard error: larger samples reduce uncertainty. The minimum detectable effect (MDE) is the smallest difference that can be detected with given sample size and confidence level. Power analysis helps determine required sample sizes: typically 80% power (β = 0.2) and 95% confidence (α = 0.05).
This problem demonstrates the statistical foundation of A/B testing. Students learn that observed differences may be due to random variation rather than actual improvements. The Z-test quantifies how likely it is that the observed difference occurred by chance. Statistical significance doesn't guarantee practical significance, but it's necessary for confident decision-making.
Z-score: Number of standard deviations from the mean
Statistical Significance: Evidence that result is not due to chance
Confidence Level: Probability that true effect lies within confidence interval
• Require 95% confidence for reliable results
• Consider practical significance too
• Use power calculators for sample size planning
• Run tests until reaching minimum duration
• Avoid peeking at results prematurely
• Stopping tests too early
• Not considering sample size requirements
• Confusing statistical with practical significance
FAQ
Q: How many visitors do I need for a statistically significant conversion test?
A: The required sample size depends on your baseline conversion rate, minimum detectable effect, and desired confidence level. The formula for sample size per variant is: n = [Zα/2² × p(1-p)] / δ², where Zα/2 is the Z-score for your confidence level (1.96 for 95%), p is the pooled proportion (baseline conversion rate), and δ is the minimum detectable effect. For example, if your baseline conversion rate is 3% (0.03) and you want to detect a 20% relative improvement (0.6% absolute improvement): n = [1.96² × 0.03(1-0.03)] / 0.006² = [3.84 × 0.0291] / 0.000036 = 0.1117 / 0.000036 = 3,103 per variant, or 6,206 total. However, this is the minimum. For robust results, consider running tests for at least 2-4 weeks to account for weekly patterns and seasonality. The power calculation ensures you can detect meaningful differences while avoiding false positives.
Q: What's the difference between micro and macro conversions?
A: Micro-conversions are smaller actions that indicate progress toward the main goal, while macro-conversions are the primary business objective. Examples: Macro-conversions include purchases, sign-ups, or quote requests that directly impact revenue. Micro-conversions include newsletter signups, product views, adding items to cart, or completing checkout steps. The relationship is: Micro-conversions → Macro-conversions. For example, in e-commerce: Newsletter signup → Product view → Add to cart → Purchase. The conversion rate formulas apply to both: CR_micro = (Micro_conversions / Visitors) × 100, CR_macro = (Macro_conversions / Visitors) × 100. Micro-conversions provide more data points for testing and help identify where users drop off in the conversion funnel. Tracking both types gives a complete picture of user behavior and helps optimize the entire customer journey. The mathematical relationship can be expressed as: Macro_CR = Micro_CR × (Macro_per_Micro_conversion_rate).