Lifetime Value Calculator
LTV calculator • 2026 metrics
Lifetime Value Formulas:
Show the calculator\( LTV = \frac{\text{Average Order Value} \times \text{Purchase Frequency}}{\text{Churn Rate}} \)
\( LTV = \frac{\text{Gross Margin per Customer}}{\text{Churn Rate}} \)
\( Churn Rate = \frac{\text{Customers Lost}}{\text{Total Customers}} \)
\( Retention Rate = 1 - Churn Rate \)
Where:
- Average Order Value = Total Revenue / Total Orders
- Purchase Frequency = Total Orders / Total Customers
- Churn Rate = Percentage of customers lost per period
- Retention Rate = Percentage of customers retained
These formulas calculate the predicted revenue from a customer over their entire relationship with the business.
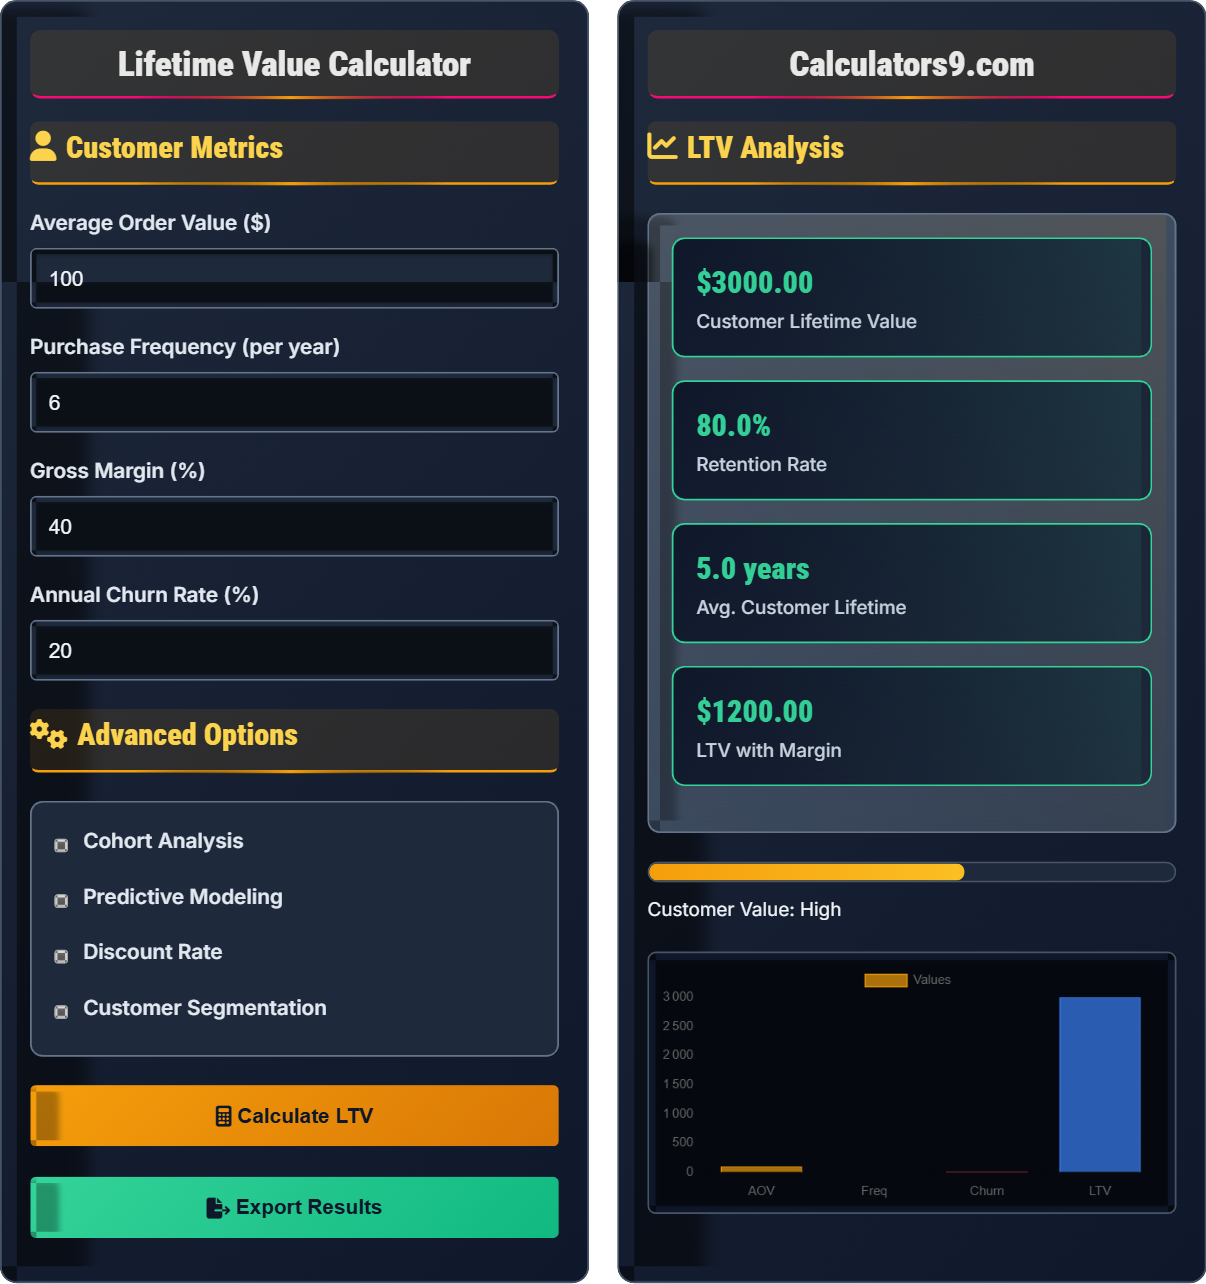
Example: For a customer with $100 AOV, 6 orders/year, and 20% annual churn rate:
\( LTV = \frac{100 \times 6}{0.20} = \frac{600}{0.20} = 3,000 \)
Thus, the customer's lifetime value is $3,000.
Customer Metrics
Advanced Options
LTV Analysis
Customer Value: High
| Metric | Formula | Value | Interpretation | Improvement |
|---|
| Period | Customers | Retention | Revenue | LTV |
|---|
Comprehensive Lifetime Value Guide
Customer Lifetime Value (LTV) is a prediction of the net profit attributed to the entire future relationship with a customer. It's a critical metric for understanding the long-term value of customers and making informed decisions about customer acquisition, retention, and resource allocation. LTV helps businesses determine how much to invest in acquiring and retaining customers while ensuring sustainable growth.
The basic LTV calculations use the following formulas:
Where:
- AOV = Average Order Value
- PF = Purchase Frequency per period
- Churn Rate = Percentage of customers lost per period
- Gross Margin per Customer = AOV × PF × Margin %
LTV influences numerous business decisions:
- Customer Acquisition: Determines maximum CAC for profitable growth
- Retention Strategies: Guides investment in customer retention programs
- Resource Allocation: Helps prioritize marketing and sales efforts
- Product Development: Identifies features for high-value customers
- Pricing Strategy: Evaluates impact of price changes on customer value
- Investment Decisions: Supports funding and growth planning
- Increase Purchase Frequency: Implement subscription models, loyalty programs, cross-selling
- Boost Average Order Value: Offer bundles, upsells, premium options
- Extend Customer Lifespan: Focus on retention, engagement, customer satisfaction
- Improve Retention Rate: Enhance onboarding, provide excellent support, personalize experiences
- Target High-Value Segments: Focus acquisition on customers likely to have high LTV
- Reduce Churn: Identify churn signals, proactive intervention, exit prevention
LTV Fundamentals
Prediction of net profit from entire customer relationship.
LTV = \(\frac{\text{AOV} \times \text{PF}}{\text{Churn Rate}}\)
LTV = \(\frac{\text{Gross Margin per Customer}}{\text{Churn Rate}}\)
- Higher retention = higher LTV
- Accurate data is essential
- Regular updates improve accuracy
Analysis Framework
LTV measures customer value; CAC measures acquisition cost.
- Collect customer behavior data
- Calculate key metrics (AOV, PF, churn)
- Apply appropriate LTV formula
- Validate against actual performance
- Seasonal variations affect metrics
- Market changes impact predictions
- Segment-specific values may vary
Lifetime Value Learning Quiz
A SaaS company has customers with an average monthly revenue of $100, a monthly churn rate of 5%, and a gross margin of 80%. What is the customer lifetime value?
The answer is B) $1,600. First, calculate the annual churn rate: 5% monthly × 12 = 60% annually. Then, calculate the LTV: LTV = (Monthly Revenue × 12) / Annual Churn Rate = ($100 × 12) / 0.60 = $1,200 / 0.60 = $2,000. However, this is gross LTV. With 80% gross margin: LTV with margin = $2,000 × 0.80 = $1,600. The key is converting monthly metrics to annual and applying the gross margin to get the net LTV.
This problem demonstrates the importance of time period consistency in LTV calculations. Students must recognize that churn rates can be expressed monthly or annually, and all metrics must be aligned to the same time frame. Additionally, the inclusion of gross margin shows how to calculate the net economic value of a customer relationship.
Churn Rate: Percentage of customers lost per time period
Monthly Recurring Revenue (MRR): Revenue from subscription customers per month
Gross Margin: Revenue minus cost of goods sold
• Align all metrics to the same time period
• Apply gross margin to get net LTV
• Higher churn rate = lower LTV
• Convert monthly rates to annual (or vice versa)
• Always consider gross margin impact
• Validate calculations with simple examples
• Mixing monthly and annual metrics
• Forgetting to apply gross margin
• Not converting time periods consistently
Explain how cohort analysis enhances LTV calculations and provides deeper insights into customer behavior. Include a mathematical model showing how to calculate LTV for different customer cohorts and discuss the strategic implications.
Cohort analysis groups customers by acquisition time to track their behavior patterns over time. The cohort-specific LTV formula is: LTV_cohort = Σ(Revenue_t / (1 + Discount_Rate)^t) for t=0 to T, where T is the average tenure of the cohort. For example, if a January 2023 cohort had: Month 1: $100 avg revenue, Month 2: $95, Month 3: $90, with 10% annual discount rate: LTV = $100 + $95/(1.1^1/12) + $90/(1.1^2/12) + ... This reveals that newer cohorts may have different behaviors than older ones. The mathematical model for cohort retention is: R_t = R_0 × (1 - Churn_Rate)^t, where R_t is retention at time t. Cohort analysis shows that early customers might have higher retention (85%) than recent ones (70%), indicating changes in product-market fit or acquisition quality. Strategic implications include: adjusting acquisition strategies for underperforming cohorts, identifying successful acquisition channels, and optimizing retention strategies for different customer groups.
This problem introduces the concept of customer heterogeneity and how different acquisition periods can result in different behaviors. Students learn that aggregate LTV can mask important differences between customer groups. Cohort analysis reveals temporal patterns and helps identify whether improvements in product or acquisition strategy are having the intended effects.
Cohort: Group of customers acquired in the same time period
Cohort Analysis: Tracking behavior of customer groups over time
Temporal Patterns: Changes in customer behavior over time
• Cohorts reveal hidden behavioral differences
• Recent cohorts may behave differently than older ones
• Use cohort analysis to validate LTV assumptions
• Segment by acquisition channel and time
• Compare cohort performance over time
• Assuming all customers behave the same
• Not accounting for seasonal variations
• Ignoring cohort-specific behaviors
FAQ
Q: How do I calculate LTV for a business with irregular purchase patterns?
A: For irregular purchase patterns, use survival analysis models. The probability-based LTV formula is: LTV = Σ(Purchase_Probability_t × Expected_Value_t) for all future periods t. Where Purchase_Probability_t is calculated using historical data and statistical models. For example, if a customer has a 30% chance of buying $100 worth of products in month 1, 20% in month 2, etc.: LTV = 0.30×$100 + 0.20×$100 + 0.15×$100 + ... For businesses with highly irregular patterns, consider using: Paretian coefficient models, Beta-Geometric/NBD models, or machine learning approaches. The key is modeling both the probability of purchase and the expected transaction value independently. This approach provides more accurate predictions for businesses with inconsistent purchase patterns like luxury goods, B2B services, or seasonal products.
Q: Should I include acquisition costs in my LTV calculation?
A: No, acquisition costs should NOT be included in LTV calculations. LTV represents the revenue/present value of profits from a customer relationship, while acquisition costs (CAC) are separate. The fundamental relationship is: Net Value = LTV - CAC. Including acquisition costs in LTV would double-count the expense. The standard LTV formula is: LTV = (Average Order Value × Purchase Frequency × Gross Margin %) / Churn Rate. If you included acquisition costs, you'd be subtracting them twice: once in LTV and again when comparing LTV to CAC. Instead, focus on the LTV:CAC ratio, which should ideally be 3:1 or higher. For example, if LTV is $300 and CAC is $100, the ratio is 3:1, indicating profitable customer acquisition. The relationship is multiplicative, not additive: Profit per Customer = LTV - CAC.