Social Media Engagement Calculator
Measure & optimize performance • 2026 metrics
Engagement Data
Advanced Options
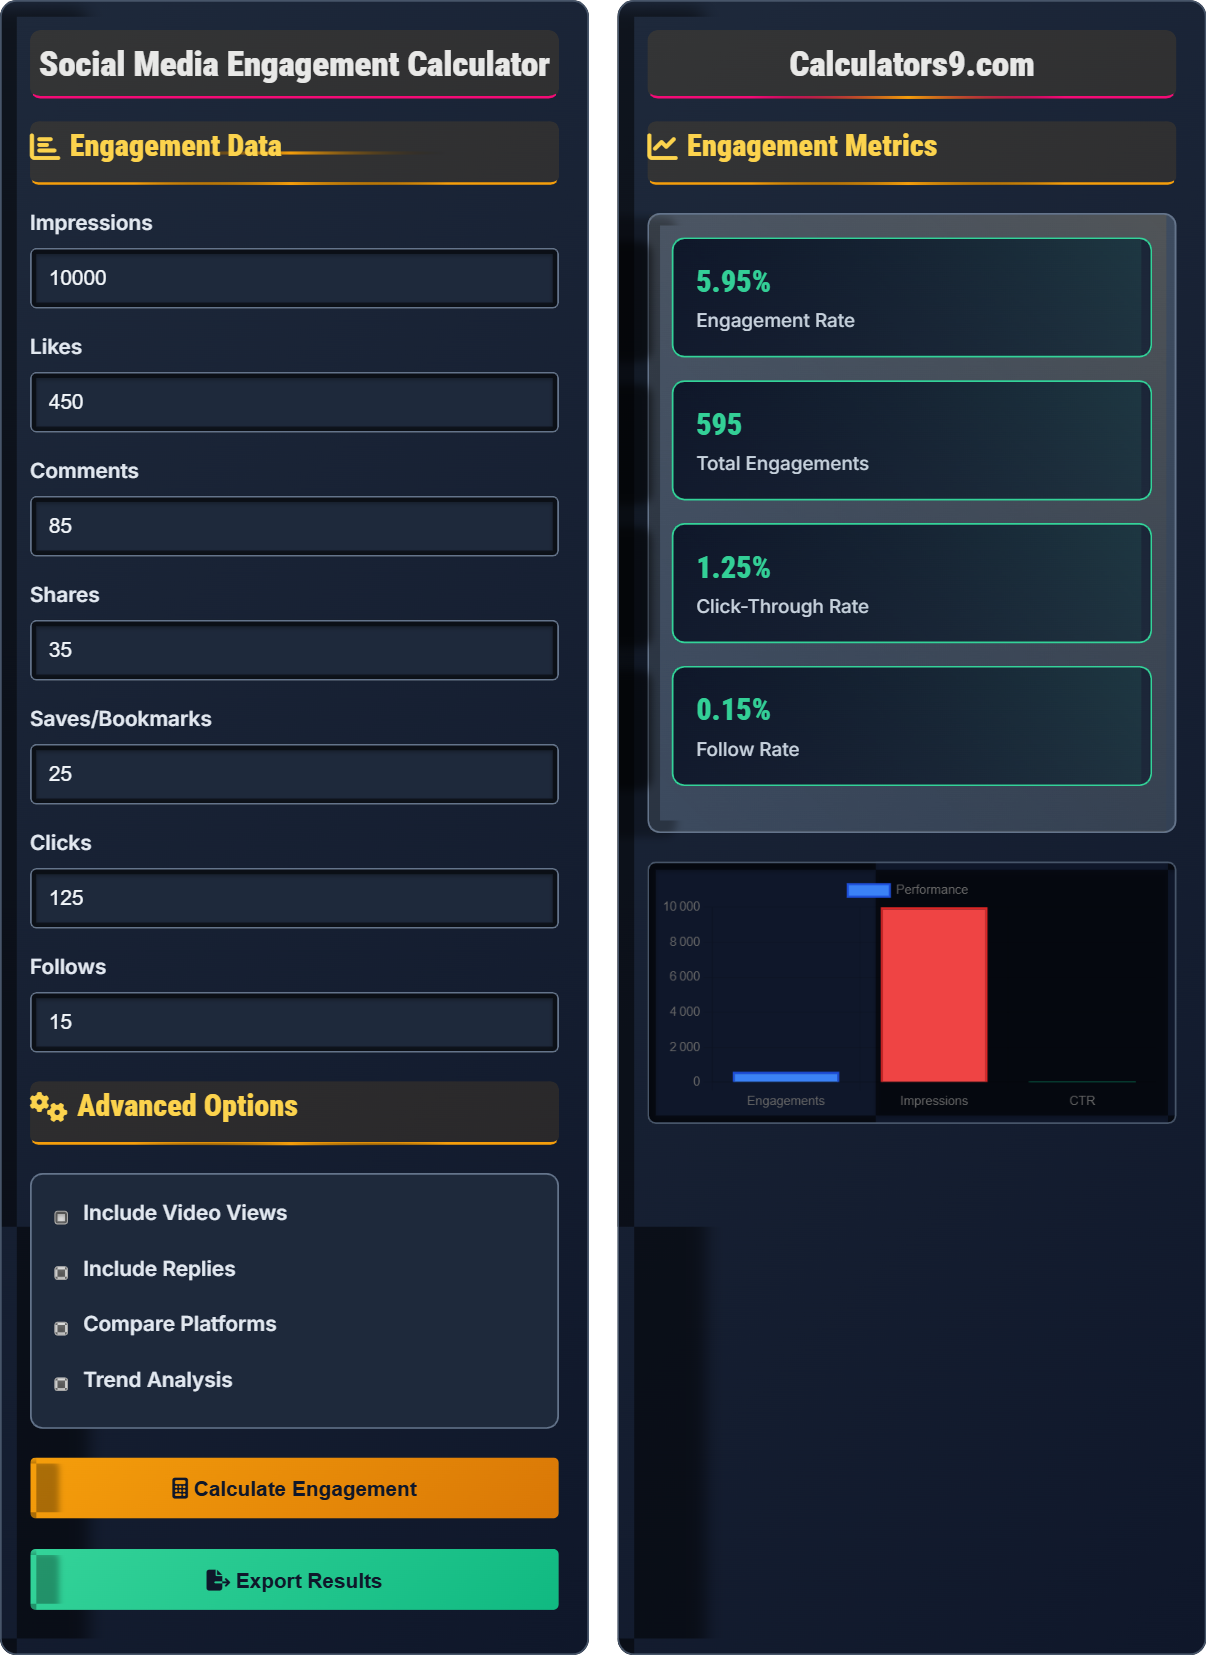
Engagement Metrics
| Metric | Count | Rate | Industry Avg |
|---|
| Engagement Type | Count | % of Total | Value |
|---|
Social Media Engagement Learning Quiz
What does engagement rate measure in social media marketing?
The answer is B) Percentage of audience interacting with content. Engagement rate measures how many people actively interact with your content compared to how many people saw it. It's calculated as total engagements divided by impressions, multiplied by 100.
Engagement rate is a crucial metric because it shows the quality of your audience relationship. A high engagement rate indicates that your content resonates with your audience and creates meaningful interactions. Unlike follower count, which can be inflated by inactive accounts, engagement rate reveals how actively involved your audience is with your brand.
Engagement Rate: Percentage of people who interact with your content compared to those who see it
Impressions: Number of times your content is displayed to users
Engagements: Actions taken on your content (likes, comments, shares, etc.)
• Engagement rate = (Total engagements ÷ Impressions) × 100
• Higher engagement rates indicate stronger audience connection
• Industry averages vary by platform (Instagram: 1-3%, Facebook: 0.08-0.6%)
• Remember: Engagement rate measures quality, not quantity
• Use the mnemonic "IEE" (Impressions, Engagements, Engagement rate)
• Compare your rates to industry benchmarks for context
• Confusing engagement rate with follower growth rate
• Not accounting for different platform benchmarks
• Ignoring the quality of engagements (sentiment matters)
Calculate the engagement rate for a post that received 1,200 impressions, 45 likes, 12 comments, and 8 shares. Show your work.
Step 1: Calculate total engagements = Likes + Comments + Shares
Total engagements = 45 + 12 + 8 = 65
Step 2: Apply the engagement rate formula
Engagement Rate = (Total Engagements ÷ Impressions) × 100
Engagement Rate = (65 ÷ 1,200) × 100 = 0.0542 × 100 = 5.42%
The engagement rate for this post is 5.42%, which is considered excellent compared to industry averages.
This calculation demonstrates how to determine engagement rate using basic arithmetic. The result of 5.42% significantly exceeds typical industry benchmarks (1-3% for Instagram, 0.08-0.6% for Facebook). This indicates the content was highly effective at generating audience interaction, possibly due to compelling visuals, timely relevance, or strategic posting.
Engagement Rate: Percentage of audience who interacted with content
Impressions: Total number of times content was displayed
Total Engagements: Sum of all interactions (likes, comments, shares, etc.)
• Always include all engagement types in the calculation
• Engagement rate is expressed as a percentage
• Higher rates indicate more effective content
• Remember: (Total Engagements ÷ Impressions) × 100
• Include all engagement types: likes, comments, shares, saves, clicks
• Compare your rate to industry benchmarks for context
• Forgetting to include all engagement types
• Dividing impressions by engagements instead of the reverse
• Not multiplying by 100 to get percentage
A company ran a social media campaign with 50,000 impressions. The campaign generated 1,200 likes, 250 comments, 180 shares, and 95 clicks. Calculate the overall engagement rate and click-through rate. Was this campaign successful compared to industry standards?
Step 1: Calculate total engagements = 1,200 + 250 + 180 = 1,630 (excluding clicks for engagement rate)
Step 2: Calculate engagement rate = (1,630 ÷ 50,000) × 100 = 3.26%
Step 3: Calculate click-through rate = (95 ÷ 50,000) × 100 = 0.19%
Step 4: Compare to industry standards
Engagement rate of 3.26% is above average for most platforms (especially Facebook and LinkedIn), indicating strong performance. The CTR of 0.19% is also good compared to the average of 0.08-0.6% for most platforms.
This example shows how to evaluate campaign success using multiple metrics. The 3.26% engagement rate significantly exceeds typical benchmarks, suggesting the campaign content resonated strongly with the audience. The 0.19% CTR is also above average, indicating effective call-to-action elements. Both metrics together suggest a successful campaign.
Engagement Rate: Percentage of audience who interacted with content
Click-Through Rate (CTR): Percentage of viewers who clicked on links
Industry Benchmark: Average performance metrics for specific platforms
• Engagement rate typically excludes clicks (but can include them)
• CTR specifically measures link clicks vs impressions
• Always compare metrics to platform-specific benchmarks
• Calculate both engagement rate and CTR for complete picture
• Use platform-specific benchmarks for accurate comparisons
• Look for correlation between engagement and conversions
• Including clicks in engagement rate calculation (sometimes)
• Using generic benchmarks instead of platform-specific ones
• Not considering the quality of engagement beyond quantity
A brand currently averages 1.2% engagement rate with 10,000 impressions per post. They want to achieve a 2.5% engagement rate. How many additional engagements would they need per post to reach this goal? If they maintain current content strategy, what would need to change?
Step 1: Current engagements = 1.2% of 10,000 = 0.012 × 10,000 = 120 engagements
Step 2: Target engagements = 2.5% of 10,000 = 0.025 × 10,000 = 250 engagements
Step 3: Additional engagements needed = 250 - 120 = 130 engagements
Step 4: To achieve this, they could either:
- Improve content quality to generate 130 more engagements per post
- Increase impressions to dilute the engagement rate requirement
- Focus on higher-value engagement types (comments, shares vs. likes)
This problem demonstrates the mathematical relationship between engagement rate, impressions, and actual engagement numbers. The brand needs to double their current engagement level to reach their target. This could involve improving content quality, posting at optimal times, using more engaging formats (videos, polls), or encouraging more meaningful interactions.
Engagement Rate: Percentage of audience who interacted with content
Content Strategy: Planned approach to creating and distributing contentQuality vs Quantity: Focus on meaningful interactions rather than just numbers
• Engagement rate is calculated as (engagements ÷ impressions) × 100
• Improving content quality often increases engagement rate
• Consistent posting can help maintain engagement levels
• Focus on content that encourages conversation and sharing
• Use analytics to identify high-performing content types
• Engage authentically with your audience to encourage more interactions
• Chasing vanity metrics instead of meaningful engagement
• Not analyzing which types of content drive the most engagement
• Expecting immediate results without adjusting strategy
Which of the following statements about social media engagement rates is TRUE?
The answer is B) TikTok has significantly higher average engagement rates than Facebook. According to recent studies, TikTok averages around 4.71% engagement rate, while Facebook averages 0.28%. This is due to TikTok's algorithm prioritizing engagement and its younger, more active user base. The fundamental calculation remains the same across platforms, though some may weight certain actions differently.
Understanding platform differences is crucial for setting realistic goals. TikTok's format and algorithm favor high engagement, while Facebook's older demographic and news feed structure result in lower interaction rates. When comparing performance, always consider the platform-specific benchmarks. The core engagement rate formula remains consistent, but context matters significantly.
Platform Benchmark: Average performance metrics for specific social media platforms
Algorithm: System that determines content distribution on platforms
Demographics: Characteristics of users on different platforms
• Always compare performance to platform-specific benchmarks
• Adjust expectations based on platform characteristics
• Focus on the right metrics for each platform's purpose
• Research current benchmarks for each platform quarterly
• Adapt content strategy to platform-specific preferences
• Track performance across platforms to identify strengths
• Using the same benchmarks across all platforms
• Not adjusting strategy for platform-specific audiences
• Focusing on vanity metrics instead of platform-appropriate goals
Engagement Basics
Percentage of audience interacting with content.
\(ER = \frac{Likes + Comments + Shares}{Impressions} \times 100\)
Where ER=engagement rate, L=likes, C=comments, S=shares, I=impressions.
- Higher rates indicate better content performance
- Industry averages vary by platform
- Quality beats quantity in engagement
Optimization Strategies
High-quality content generates more meaningful interactions.
- Post at optimal times
- Use compelling visuals
- Encourage interaction
- Respond to comments
- Consistency builds audience
- Authenticity drives engagement
- Analytics inform strategy
- Platform-specific tactics
FAQ
Q: What's a good engagement rate?
A: Good rates vary by platform: Instagram (1-3%), Facebook (0.08-0.6%), Twitter (0.5-2%), TikTok (4-6%). Above average is excellent.
Q: How can I improve engagement?
A: Post consistently at optimal times, use high-quality visuals, ask questions, respond to comments, and create valuable content that encourages sharing.