Cost Calculator
Fast cost calculator • 2026 metrics
Cost Calculation Formulas:
Show the calculator\( TC = FC + VC \)
\( BEP = \frac{FC}{P - VC/u} \)
Where:
- \( TC \) = Total Costs
- \( FC \) = Fixed Costs
- \( VC \) = Variable Costs
- \( BEP \) = Break-Even Point (in units)
- \( P \) = Price per Unit
- \( VC/u \) = Variable Cost per Unit
These formulas calculate total business expenses and the point at which revenue equals total costs.
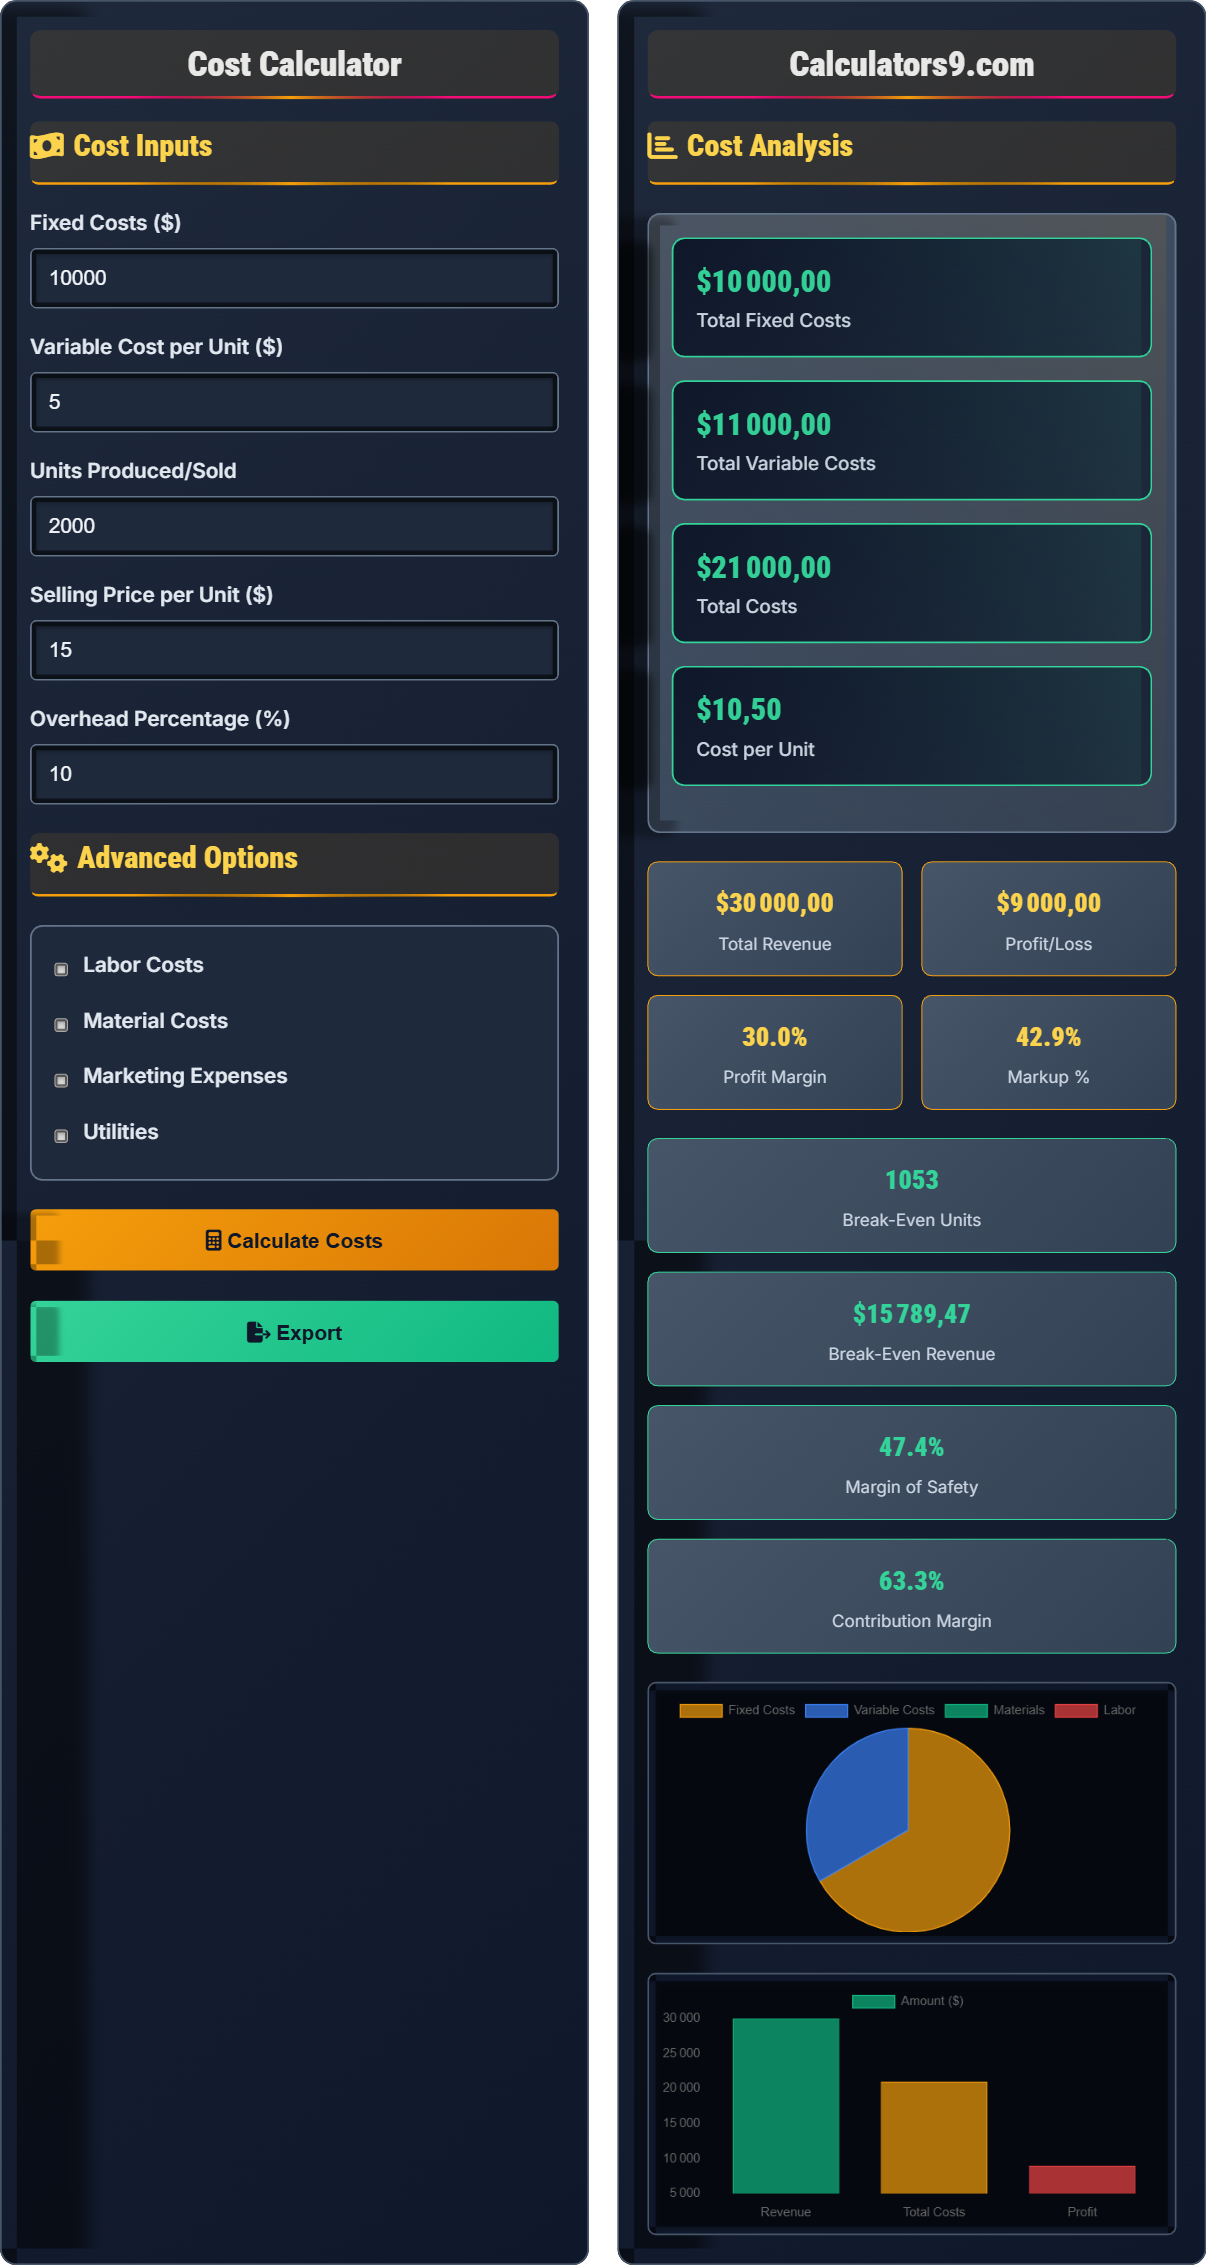
Example: Fixed costs of $10,000, variable costs of $5/unit, selling at $15/unit:
Break-even: \( BEP = \frac{10,000}{15 - 5} = \frac{10,000}{10} = 1,000 \) units
At 1,000 units sold, total revenue ($15,000) equals total costs ($15,000).
Cost Inputs
Advanced Options
Cost Analysis
Comprehensive Cost Guide
Business costs are the expenses incurred in the operation of a business. These include all expenditures related to producing goods or services, maintaining operations, and supporting business activities. Understanding cost structure is essential for pricing, profitability analysis, and strategic decision-making.
The fundamental cost calculation uses the following formulas:
Where:
- \(TC\) = Total Costs
- \(FC\) = Fixed Costs
- \(VC\) = Variable Costs
Effective cost allocation ensures accurate financial reporting and decision-making:
- Direct Allocation: Assigning costs directly to specific departments or products
- Activity-Based Costing (ABC): Allocating costs based on activities that drive expenses
- Traditional Allocation: Using predetermined rates based on volume metrics
- Time-Driven ABC: More precise allocation using time equations
- Cost Control: Monitoring and regulating expenses to stay within budget
- Cost Reduction: Systematically eliminating unnecessary expenses
- Process Improvement: Optimizing operations to reduce resource consumption
- Technology Integration: Automating processes to reduce labor costs
- Supplier Negotiation: Securing better terms with vendors
Cost Basics
All expenses incurred in running a business operation.
\(TC = FC + VC\)
Where TC=total costs, FC=fixed costs, VC=variable costs.
- Fixed costs don't change with volume
- Variable costs scale with production
- Accurate costing improves pricing
Strategies
Determine the point where revenue equals total costs.
- Calculate contribution margin: Price - Variable cost
- Divide fixed costs by contribution margin
- Result is break-even units
- Multiply by price for break-even revenue
- Costs must be accurately classified
- Market demand affects sales volume
- External factors impact costs
- Regular review of cost structure
Cost Learning Quiz
Which of the following is an example of a variable cost?
The answer is C) Raw materials used in production. Variable costs change proportionally with the level of production or activity. As production increases, raw material costs increase accordingly. Fixed costs (rent, salary, insurance) remain constant regardless of production volume.
Understanding cost behavior is fundamental to cost-volume-profit analysis. Variable costs have a direct relationship with activity levels, while fixed costs remain unchanged within a relevant range. Mixed costs contain both fixed and variable components. This classification is essential for accurate budgeting and decision-making.
Variable Cost: Cost that changes in direct proportion to activity level
Fixed Cost: Cost that remains constant regardless of activity level
Cost Behavior: How costs change with activity levels
• Variable costs per unit remain constant
• Total variable costs change with volume
• Fixed costs per unit decrease with volume
• Think "per unit" for variable costs
• Think "total amount" for fixed costs
• Plot costs against volume to visualize behavior
• Confusing total variable costs with per-unit variable costs
• Misclassifying mixed costs as purely fixed or variable
• Assuming all costs behave linearly
A company has fixed costs of $12,000 per month, variable costs of $8 per unit, and produces 3,000 units. What are the total costs and cost per unit?
Step 1: Calculate total variable costs = Variable cost per unit × Units produced
Total variable costs = $8 × 3,000 = $24,000
Step 2: Calculate total costs = Fixed costs + Variable costs
Total costs = $12,000 + $24,000 = $36,000
Step 3: Calculate cost per unit = Total costs ÷ Units produced
Cost per unit = $36,000 ÷ 3,000 = $12 per unit
This problem demonstrates the fundamental cost calculation. Note that while total variable costs increase with production, the variable cost per unit remains constant. Meanwhile, fixed costs per unit decrease as production volume increases, demonstrating economies of scale.
Total Costs: Sum of all fixed and variable expenses
Unit Cost: Average cost per unit produced
Economies of Scale: Decreasing per-unit costs with increased volume
• Total variable costs change with volume
• Fixed costs per unit decrease with volume
• Variable costs per unit remain constant
• Always identify fixed vs variable components first
• Remember: per-unit costs change differently than totals
• Graph the relationships to visualize cost behavior
• Adding per-unit variable costs to total fixed costs
• Forgetting to divide total costs by units for per-unit calculation
• Confusing average total cost with marginal cost
A manufacturer has fixed costs of $20,000 per month, variable costs of $10 per unit, and sells each unit for $25. Calculate the break-even point in units and revenue. How many units must be sold to earn a profit of $10,000?
Step 1: Calculate contribution margin per unit = Selling price - Variable cost
Contribution margin = $25 - $10 = $15 per unit
Step 2: Calculate break-even units = Fixed costs ÷ Contribution margin
Break-even units = $20,000 ÷ $15 = 1,333.33 units (round up to 1,334)
Step 3: Calculate break-even revenue = Break-even units × Selling price
Break-even revenue = 1,334 × $25 = $33,350
Step 4: Units for $10,000 profit = (Fixed costs + Desired profit) ÷ Contribution margin
Units for profit = ($20,000 + $10,000) ÷ $15 = 2,000 units
Therefore, break-even occurs at 1,334 units ($33,350 revenue), and 2,000 units are needed for $10,000 profit.
Break-even analysis is crucial for business planning. The contribution margin represents the amount each unit contributes to covering fixed costs and generating profit. Once fixed costs are covered (break-even point), each additional unit sold contributes entirely to profit. This analysis helps set sales targets and evaluate pricing strategies.
Break-Even Point: Level of sales where revenue equals total costs
Contribution Margin: Revenue remaining after variable costs
Margin of Safety: Difference between actual and break-even sales
• BEP(units) = Fixed Costs ÷ Contribution Margin per Unit
• BEP(revenue) = Fixed Costs ÷ Contribution Margin Ratio
• Each unit beyond BEP adds full contribution margin to profit
• Always round break-even units up to next whole number
• Contribution margin ratio = CM per unit ÷ Selling price
• Use break-even analysis for pricing decisions
• Forgetting to add desired profit to fixed costs
• Dividing fixed costs by selling price instead of contribution margin
• Confusing contribution margin with gross margin
A company currently has fixed costs of $30,000, variable costs of $12 per unit, and sells 5,000 units at $25 each. They're considering investing $10,000 in equipment that would reduce variable costs to $8 per unit. Should they make this investment? Calculate the impact on profit and break-even point.
Current situation:
Revenue = 5,000 × $25 = $125,000
Variable costs = 5,000 × $12 = $60,000
Total costs = $30,000 + $60,000 = $90,000
Profit = $125,000 - $90,000 = $35,000
Break-even = $30,000 ÷ ($25 - $12) = $30,000 ÷ $13 = 2,308 units
With investment:
New fixed costs = $30,000 + $10,000 = $40,000
New variable costs = 5,000 × $8 = $40,000
New total costs = $40,000 + $40,000 = $80,000
New profit = $125,000 - $80,000 = $45,000
New break-even = $40,000 ÷ ($25 - $8) = $40,000 ÷ $17 = 2,353 units
The investment increases profit by $10,000 but slightly increases break-even units. It's beneficial if sales volume remains stable.
This demonstrates the trade-off between fixed and variable costs. Converting variable costs to fixed costs (through automation or equipment) can increase profitability at higher volumes but raises the break-even threshold. Companies must consider their expected sales volume when making such decisions. The decision depends on the risk tolerance and expected future sales.
Operating Leverage: Degree to which fixed costs are used in operations
Cost Structure: Mix of fixed and variable costs
Investment Decision: Evaluation of cost trade-offs
• Higher fixed costs increase break-even point
• Lower variable costs improve contribution margin
• Evaluate decisions based on expected volume
• Calculate ROI on cost reduction investments
• Consider volume uncertainty in decision-making
• Analyze sensitivity to volume changes
• Not considering the impact on break-even point when changing cost structure
• Focusing only on per-unit costs without considering total impact
• Ignoring the risk associated with higher fixed costs
Which cost allocation method provides the most accurate product costing in a diverse manufacturing environment?
The answer is B) Activity-Based Costing (ABC). ABC allocates overhead costs based on the activities that drive those costs, providing more accurate product costing than traditional methods that use single volume-based drivers like direct labor hours. ABC recognizes that different products consume resources differently.
Traditional costing methods often misallocate costs by using a single driver that may not reflect actual resource consumption. ABC identifies cost drivers for various activities and allocates costs more precisely. This is especially important in diverse manufacturing environments where products have different resource requirements, complexity levels, and processing needs.
Activity-Based Costing (ABC): Costing method based on activities that drive costs
Cost Driver: Factor that causes costs to be incurred
Cost Pool: Collection of costs related to an activity
• Match cost drivers to actual resource consumption
• More complex systems provide more accurate costing
• Balance accuracy with implementation costs
• Identify major activities that consume resources
• Select appropriate cost drivers for each activity
• Regularly review and update cost allocation methods
• Using outdated cost drivers that no longer reflect operations
• Over-complicating the system beyond practical needs
• Failing to update allocations as operations change
FAQ
Q: How do I determine if a cost is fixed or variable?
A: To classify costs, ask whether they change with the level of business activity:
- Fixed Costs: Remain constant within a relevant range regardless of production/sales volume (e.g., rent, insurance, salaried employees)
- Variable Costs: Change proportionally with activity level (e.g., raw materials, direct labor, shipping)
Some costs are mixed (semi-variable), containing both fixed and variable components. For example, electricity has a base charge (fixed) plus usage charges (variable). The classification depends on the time frame and relevant range of activity.
Q: Should I focus on reducing fixed costs or variable costs?
A: The focus depends on your business model and market conditions:
- Reduce Variable Costs: When volume is uncertain or declining. This directly impacts per-unit profitability.
- Reduce Fixed Costs: When facing consistent low volumes or restructuring. This lowers the break-even point.
Generally, variable cost reductions improve profitability immediately with each sale, while fixed cost reductions provide leverage as volume increases. Consider your business's operating leverage and risk tolerance when deciding which approach to prioritize.