Revenue Calculator
Fast revenue calculator • 2026 metrics
Revenue Formula:
Show the calculator\( R = U \times P \)
Where:
- \( R \) = Total Revenue
- \( U \) = Units Sold
- \( P \) = Price per Unit
For multiple products: \( R = \sum (U_i \times P_i) \)
For recurring revenue: \( R = MRR \times 12 \) (Annual Recurring Revenue)
This formula calculates the total income generated from sales of products or services.
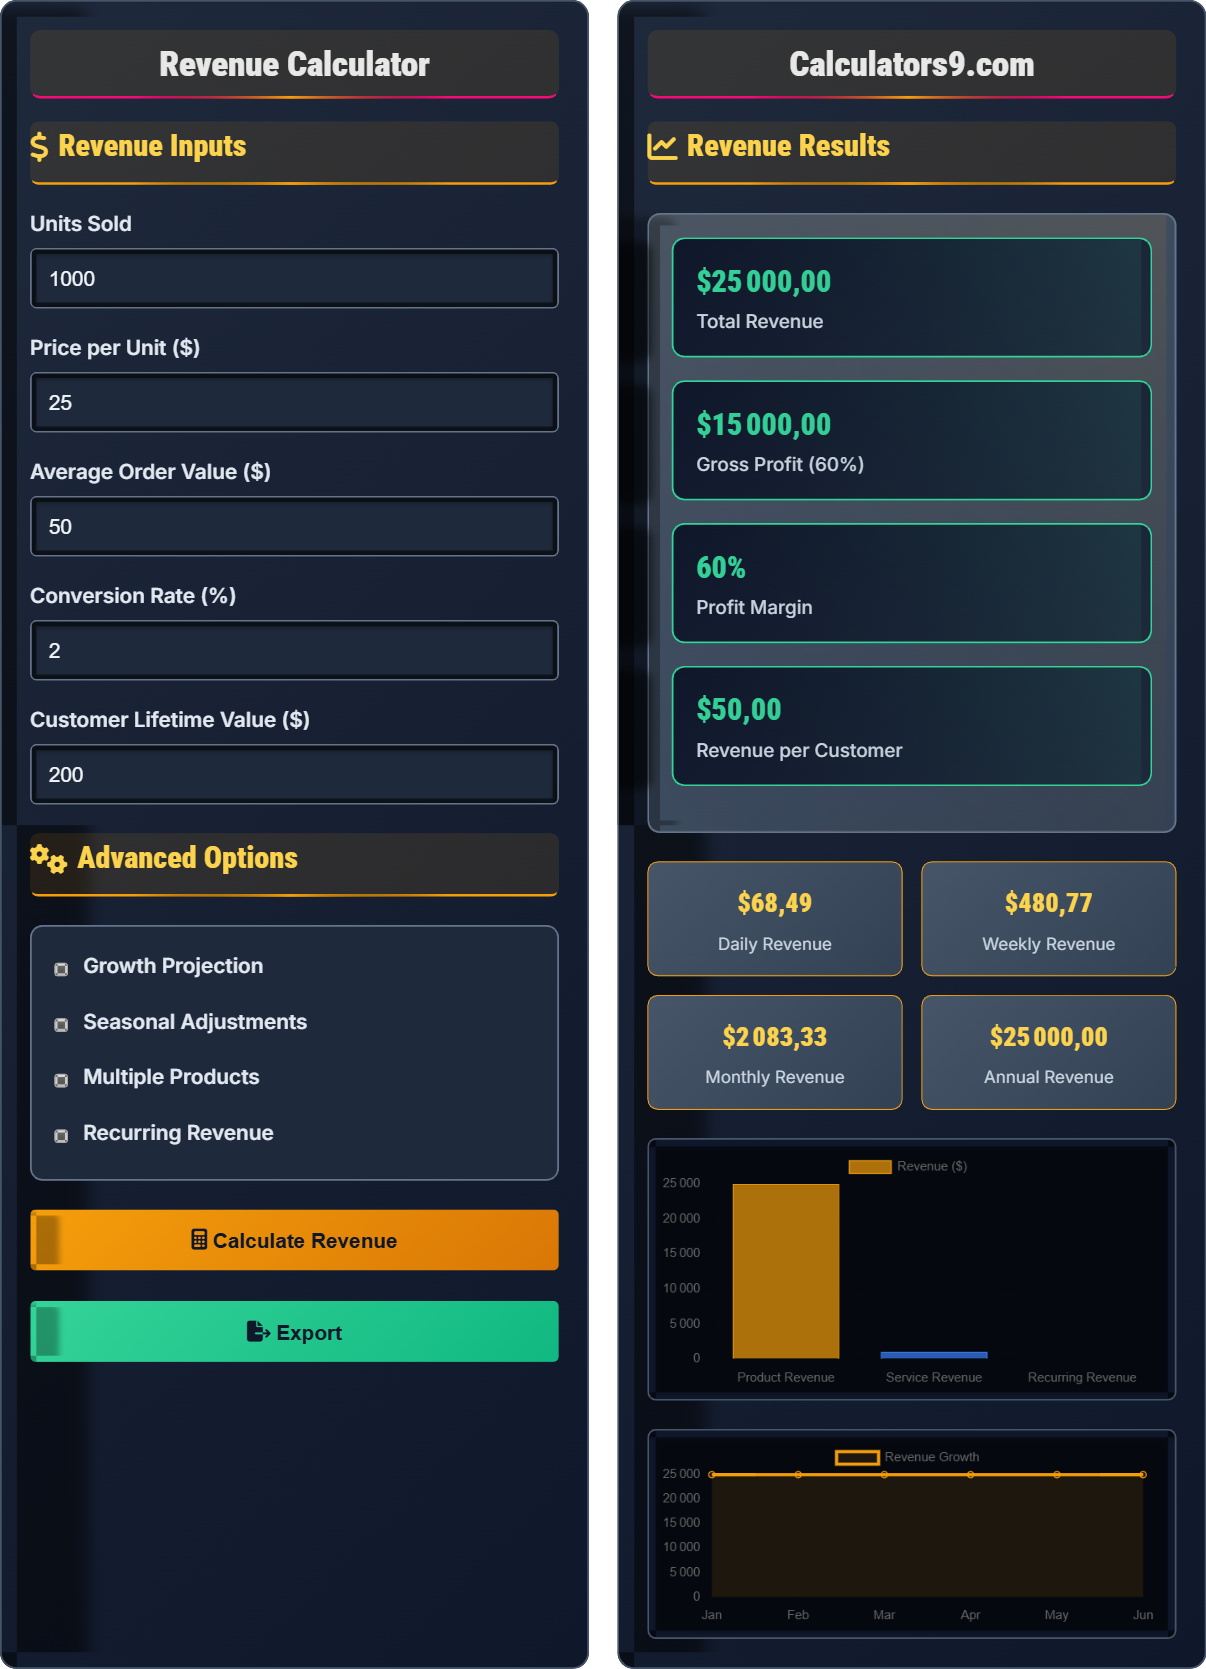
Example: Selling 1,000 units at $25 each: \( R = 1,000 \times 25 = \$25,000 \)
Advanced revenue models include subscription revenue, one-time sales, and hybrid models.
Revenue Inputs
Advanced Options
Revenue Results
Comprehensive Revenue Guide
Revenue is the total income generated by a business from its normal operations, including sales of goods and services before any expenses are deducted. It represents the top line of a company's income statement and is a key indicator of business performance and growth potential.
The basic revenue calculation uses the following formula:
Where:
- \(R\) = Total Revenue
- \(U\) = Units Sold
- \(P\) = Price per Unit
Your total revenue typically includes several components:
- Primary Sales: Main products or services that generate core revenue
- Secondary Sales: Complementary products or upsells
- Recurring Revenue: Predictable income streams from subscriptions or contracts
- One-time Revenue: Project-based or transactional income
- Price Optimization: Adjust pricing to maximize revenue without losing customers
- Volume Growth: Increase sales volume through marketing and expansion
- Upselling/Cross-selling: Offer complementary products or premium versions
- Market Expansion: Enter new markets or customer segments
- Retention Focus: Keep existing customers happy to maintain recurring revenue
Revenue Basics
Total income generated from business activities before expenses.
\(R = U \times P\)
Where R=revenue, U=units sold, P=price per unit.
- Revenue comes before expenses
- Growth requires volume or price increases
- Recurring revenue is more valuable
Strategies
Focus on increasing customer acquisition and retention.
- Improve conversion rates
- Increase average order value
- Expand product offerings
- Target new customer segments
- Quality over quantity
- Sustainable growth
- Customer lifetime value
- Market saturation
Revenue Learning Quiz
Which of the following is NOT considered part of a company's total revenue?
The answer is C) Investment gains. While investment gains contribute to net income, they are not considered part of operating revenue, which comes from core business activities like selling products and services. Revenue specifically refers to income from normal business operations.
It's important to distinguish between operating revenue and non-operating income. Operating revenue reflects the core business model and sustainability, while non-operating items like investment gains are typically one-time or irregular. Investors and analysts focus heavily on operating revenue as it indicates the health of the primary business.
Operating Revenue: Income from core business activities like sales and services
Non-operating Income: Income from activities not related to core business operations
Total Revenue: Sum of all operating income before expenses
• Revenue comes from primary business activities
• Investment gains are separate from operating revenue
• Operating revenue indicates business health
• Look for "operating revenue" vs "total revenue" in financial reports
• Focus on sustainable revenue streams
• Including one-time gains in recurring revenue calculations
• Confusing gross receipts with net revenue
A company sells 2,500 units of a product at $40 each. They also provide services worth $15,000. What is their total revenue?
Step 1: Calculate product revenue = Units sold × Price per unit
Product revenue = 2,500 × $40 = $100,000
Step 2: Add service revenue = $15,000
Step 3: Total revenue = Product revenue + Service revenue
Total revenue = $100,000 + $15,000 = $115,000
This problem demonstrates how to calculate revenue from multiple sources. When a company has different revenue streams (products and services), you must calculate each separately and then sum them. This approach helps in understanding which revenue streams are most profitable and sustainable.
Product Revenue: Income from selling tangible or digital products
Service Revenue: Income from providing services
Total Revenue: Sum of all revenue streams
• Calculate each revenue stream separately
• Sum all streams for total revenue
• Different streams may have different margins
• Break down revenue by source for better analysis
• Track revenue streams separately for strategic planning
• Forgetting to include all revenue sources
• Mixing up units and prices in calculations
E-commerce store had revenue of $80,000 in Q1 and $96,000 in Q2. What was the percentage growth in revenue from Q1 to Q2? If this growth continues, what would projected Q3 revenue be?
Step 1: Calculate growth amount = Q2 revenue - Q1 revenue = $96,000 - $80,000 = $16,000
Step 2: Calculate growth percentage = (Growth amount ÷ Q1 revenue) × 100
Growth percentage = ($16,000 ÷ $80,000) × 100 = 20%
Step 3: Project Q3 revenue = Q2 revenue × (1 + growth rate)
Projected Q3 revenue = $96,000 × 1.20 = $115,200
Therefore, revenue grew by 20% from Q1 to Q2, and if sustained, Q3 revenue would be $115,200.
This example shows how to calculate percentage growth and project future revenue. Understanding growth rates is crucial for business planning and investor relations. The compound growth concept means that each period builds on the previous one, leading to exponential increases over time.
Percentage Growth: Relative increase expressed as a percentage
Compound Growth: Growth that builds on previous growth periods
Revenue Projection: Forecasting future revenue based on trends
• Growth rate = (New - Old) ÷ Old × 100
• Projected revenue = Current × (1 + growth rate)
• Sustained growth becomes increasingly difficult
• Use geometric mean for multi-period growth rates
• Consider market saturation limits
• Account for seasonality in projections
• Using simple average instead of compound growth
• Extrapolating unsustainable growth indefinitely
• Not accounting for external factors affecting growth
A SaaS company currently has 1,000 subscribers paying $50/month. They're considering raising prices to $60/month, which they expect will cause 10% of customers to churn. Calculate the revenue impact of this pricing change. Should they proceed?
Step 1: Calculate current MRR = 1,000 × $50 = $50,000
Step 2: Calculate new subscriber count = 1,000 × (1 - 0.10) = 900 subscribers
Step 3: Calculate new MRR = 900 × $60 = $54,000
Step 4: Calculate revenue impact = New MRR - Current MRR = $54,000 - $50,000 = $4,000
Step 5: Calculate percentage change = ($4,000 ÷ $50,000) × 100 = 8%
Therefore, despite losing 10% of customers, the company would gain 8% more revenue ($4,000/month). The pricing change would be beneficial.
This demonstrates the price elasticity concept in revenue management. Sometimes increasing prices can lead to higher overall revenue even with customer loss, especially in SaaS businesses where customer acquisition costs are high. The key is finding the optimal price point that maximizes revenue without excessive churn.
MRR (Monthly Recurring Revenue): Predictable revenue from subscriptions
Churn Rate: Percentage of customers who cancel subscriptions
Price Elasticity: How demand changes with price changes
• Revenue = (Customers × Retention) × Price
• Higher prices may reduce customer base
• Find optimal price for maximum revenue
• Test pricing changes with small customer segments first
• Consider value perception vs. cost perception
• Monitor churn closely after price changes
• Assuming all customers will accept price increases
• Not considering competitive landscape
• Ignoring customer feedback on pricing
According to accounting standards, when should revenue be recognized?
The answer is B) When the sale is made and control transferred. Under ASC 606 and IFRS 15, revenue should be recognized when the company satisfies its performance obligations by transferring promised goods or services to customers. This follows the accrual basis of accounting rather than cash basis.
Revenue recognition is critical for accurate financial reporting. The modern standard (ASC 606) focuses on the transfer of control rather than simply the transfer of risks and rewards. This affects when and how much revenue companies report, impacting financial metrics and investor perceptions.
ASC 606: Revenue recognition standard for US GAAP
Performance Obligation: Promise to transfer goods/services to customer
Control Transfer: Point when customer gains control of asset
• Recognize revenue when performance obligation is satisfied
• Transfer of control determines timing
• Not tied to cash collection timing
• Understand your contract terms for revenue timing
• Consider variable consideration in estimates
• Document performance obligations clearly
• Recognizing revenue before delivering goods/services
• Confusing billing with revenue recognition
• Not considering variable consideration properly
FAQ
Q: How do I differentiate between revenue and profit?
A: Revenue and profit are fundamentally different concepts in financial accounting:
- Revenue: Total income from sales before any expenses. This is the "top line" of your income statement.
- Profit: What remains after subtracting all expenses from revenue. This is the "bottom line."
Formula: \( \text{Profit} = \text{Revenue} - \text{Expenses} \)
For example, if a company generates $100,000 in revenue and has $60,000 in expenses, their profit is $40,000. Revenue measures sales success, while profit measures overall business efficiency.
Q: Should I prioritize revenue growth or profitability?
A: The priority depends on your business stage and market dynamics:
- Early Stage: Focus on revenue growth to capture market share and demonstrate scalability. Many successful tech companies prioritize growth over immediate profits.
- Mature Market: Emphasize profitability for sustainability. Investors expect returns on their investment.
Consider this framework: High-growth companies can command higher valuations even with losses if they demonstrate strong revenue growth and clear path to profitability. However, sustainable unit economics are crucial for long-term success regardless of growth stage.