Historical Currency Converter
Convert money across historical time periods • Past value
Historical Currency Formula:
Show the calculator\( CV_t = CV_0 \times \left(\frac{CPI_t}{CPI_0}\right) \)
Where:
- \( CV_t \) = Converted Value at time t
- \( CV_0 \) = Original Value at base time
- \( CPI_t \) = Consumer Price Index at target time
- \( CPI_0 \) = Consumer Price Index at base time
This formula converts monetary amounts between different historical periods by accounting for changes in purchasing power due to inflation or deflation.
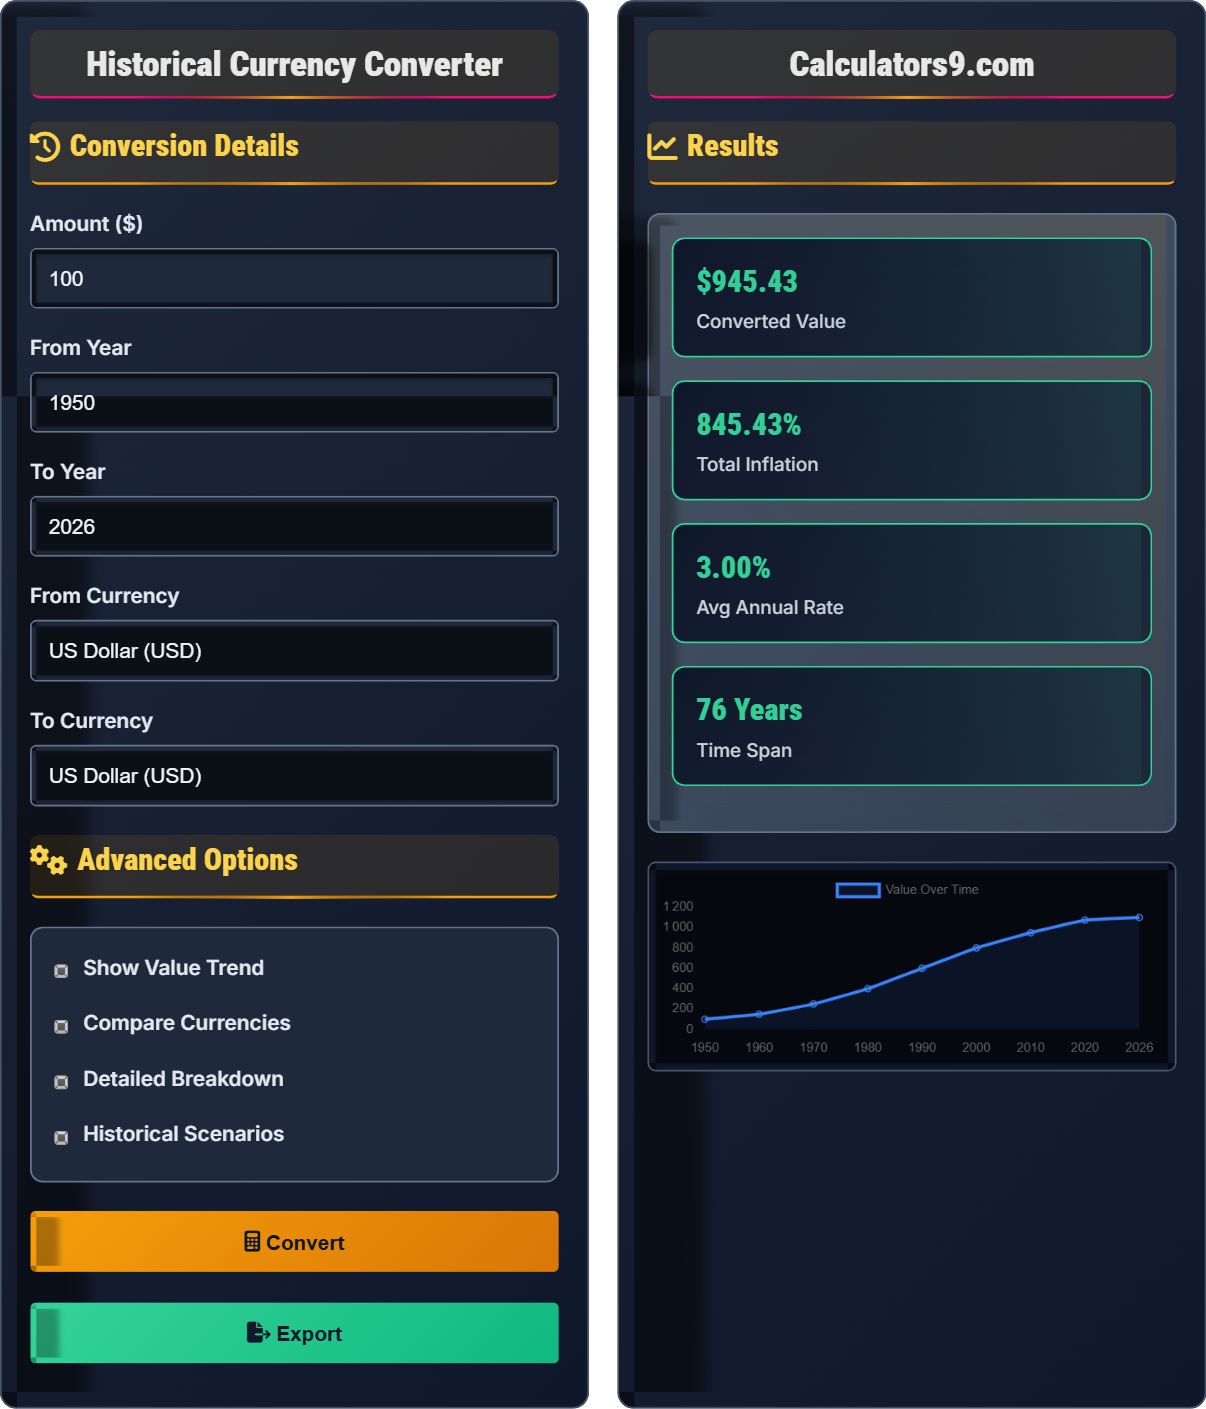
Example: Converting $100 from 1950 to 2020 value:
Assuming CPI in 1950 = 24.1, CPI in 2020 = 258.8
Converted Value:
\( CV_{2020} = 100 \times \left(\frac{258.8}{24.1}\right) \approx 1073.86 \)
Thus, $100 in 1950 is equivalent to approximately $1,073.86 in 2020.
Conversion Details
Advanced Options
Results
| Period | Years | Original | Converted | Inflation |
|---|
| Historical Period | WWII Era | Great Depression | Post-War Boom | Modern Era |
|---|
Comprehensive Historical Currency Guide
Historical currency conversion is the process of determining the equivalent value of money across different time periods, accounting for changes in purchasing power due to inflation, deflation, and economic events. This allows us to understand the real value of money in historical context and compare economic conditions across different eras.
The standard historical currency conversion calculation uses the following formula:
Where:
- \(CV_t\) = Converted Value at target time
- \(CV_0\) = Original Value at base time
- \(CPI_t\) = Consumer Price Index at target time
- \(CPI_0\) = Consumer Price Index at base time
Several factors influence historical currency values:
- Government Policy: Monetary and fiscal policies affect currency stability
- War and Conflict: Wars often lead to currency devaluation
- Technological Innovation: Productivity gains can offset inflation
- Global Trade: International commerce affects currency demand
- Demographics: Population changes impact economic demand
- Quality of Life: Same money amount means different lifestyles across eras
- Available Goods: New products didn't exist in earlier periods
- Regional Variations: Economic conditions varied by location
- Measurement Accuracy: Older data may be less precise
- Black Markets: Official rates may not reflect actual purchasing power
Currency History
Converting money value across different time periods.
\(CV_t = CV_0\frac{CPI_t}{CPI_0}\)
Where CV=value, CPI=consumer price index.
- Account for inflation/deflation over time
- Consider historical context
- Older data may be less accurate
Historical Context
Major factors affecting currency values.
- Great Depression (1929-1939)
- World War II (1939-1945)
- Post-War Boom (1945-1970)
- Stagflation (1970-1982)
- Quality of life changes over time
- New products unavailable in past
- Regional variations exist
- Data accuracy varies by era
Historical Currency Learning Quiz
If $100 in 1950 is equivalent to $1,000 in 2020, what does this tell us about the purchasing power of money?
The answer is B) The purchasing power decreased by 90%. If $100 in 1950 equals $1,000 in 2020, it means that what cost $100 in 1950 costs $1,000 in 2020. The purchasing power of the 1950 dollar is only 10% of its 2020 equivalent (100/1000 = 0.1 = 10%), meaning it lost 90% of its purchasing power.
When comparing purchasing power across time, think of it inversely: if more money is needed in the later period to buy the same goods, the earlier money had greater purchasing power. The formula to calculate purchasing power loss is: 1 - (Original Amount / Equivalent Amount).
Purchasing Power: The amount of goods or services that can be bought with a unit of currency
Inflation: Sustained increase in general price levels
Consumer Price Index: Measure tracking price changes over time
• More money needed = less purchasing power
• Equivalent value maintains same buying power
• Inflation erodes currency value over time
• Think: "What could $X buy then vs now?"
• Remember: Inflation reduces purchasing power
• Confusing price increase with purchasing power increase
• Thinking more money always means more power
A house sold for $15,000 in 1970. Calculate its equivalent value in 2020 dollars, given that the CPI was 38.8 in 1970 and 258.8 in 2020. Also calculate the percentage increase in value and discuss how this compares to the general inflation rate over the same period.
Using the historical currency formula: \(CV_t = CV_0 \times \frac{CPI_t}{CPI_0}\)
Step 1: Identify the known values:
• Original Value (\(CV_0\)): $15,000
• CPI in 1970 (\(CPI_0\)): 38.8
• CPI in 2020 (\(CPI_t\)): 258.8
Step 2: Calculate the equivalent value in 2020:
\(CV_{2020} = 15,000 \times \frac{258.8}{38.8}\)
\(CV_{2020} = 15,000 \times 6.670\)
\(CV_{2020} = 100,050\)
Step 3: Calculate the percentage increase:
Percentage Increase = \(\frac{New - Old}{Old} \times 100\)
Percentage Increase = \(\frac{100,050 - 15,000}{15,000} \times 100 = 567%\)
Step 4: Calculate the general inflation rate:
General Inflation = \(\frac{258.8 - 38.8}{38.8} \times 100 = 567%\)
Therefore, the house that sold for $15,000 in 1970 would cost approximately $100,050 in 2020 dollars, representing a 567% increase in value. This matches the general inflation rate over the same period, indicating the house maintained its value relative to the general price level.
This problem demonstrates how historical currency conversion works. The house maintained its relative value compared to general inflation. If the house had appreciated more than 567%, it would have outpaced inflation; if less, it would have underperformed. Real estate often serves as an inflation hedge, though performance varies by location and time period.
Consumer Price Index (CPI): Measure tracking price changes over time
Historical Conversion: Adjusting for inflation to compare values across timeInflation Hedge: Investment that preserves value during inflation
• Use consistent CPI values for accurate conversion
• Compare to general inflation to assess performance
• Historical data provides context for current values
• The CPI ratio tells you how many times more expensive things became
• Real estate often keeps pace with inflation over long periods
• Using incorrect CPI values for the wrong years
• Forgetting to divide by the original CPI value
• Confusing percentage increase with multiplier
FAQ
Q: How accurate are historical currency conversions, especially for periods before 1950?
A: The accuracy of historical currency conversions varies significantly by time period:
Modern Era (1950-present): Very accurate with standardized CPI measurements and comprehensive data collection.
Early 20th Century (1900-1950): Reasonably accurate but based on less comprehensive data. The CPI wasn't established until 1913 in the US.
19th Century: Less accurate with estimates based on limited commodity price data. Significant regional variations existed.
Pre-Industrial Era: Highly approximate with data based on sparse records of common goods.
Key limitations include: incomplete market coverage, changing consumption patterns, quality improvements in goods, and regional price variations. Modern conversions provide good approximations but shouldn't be treated as exact equivalencies. The further back in time you go, the greater the uncertainty in conversions.
Q: Why does historical currency conversion matter for financial planning?
A: Historical currency conversion is crucial for financial planning because:
1. Long-term Goal Setting: Understanding how inflation has affected purchasing power helps set realistic targets for retirement, education, and other long-term goals.
2. Investment Expectations: Historical data provides context for evaluating investment returns. An 8% return might seem good until you realize inflation averaged 3% over the same period.
3. Salary Negotiations: Understanding historical wage growth helps evaluate compensation packages appropriately.
4. Asset Allocation: Knowing how different asset classes performed during various economic periods helps create resilient portfolios.
5. Policy Evaluation: Assessing the effectiveness of monetary and fiscal policies by examining their impact on currency value.
Without historical perspective, financial decisions are made in a vacuum, potentially leading to unrealistic expectations or inadequate planning for inflation's erosive effects.