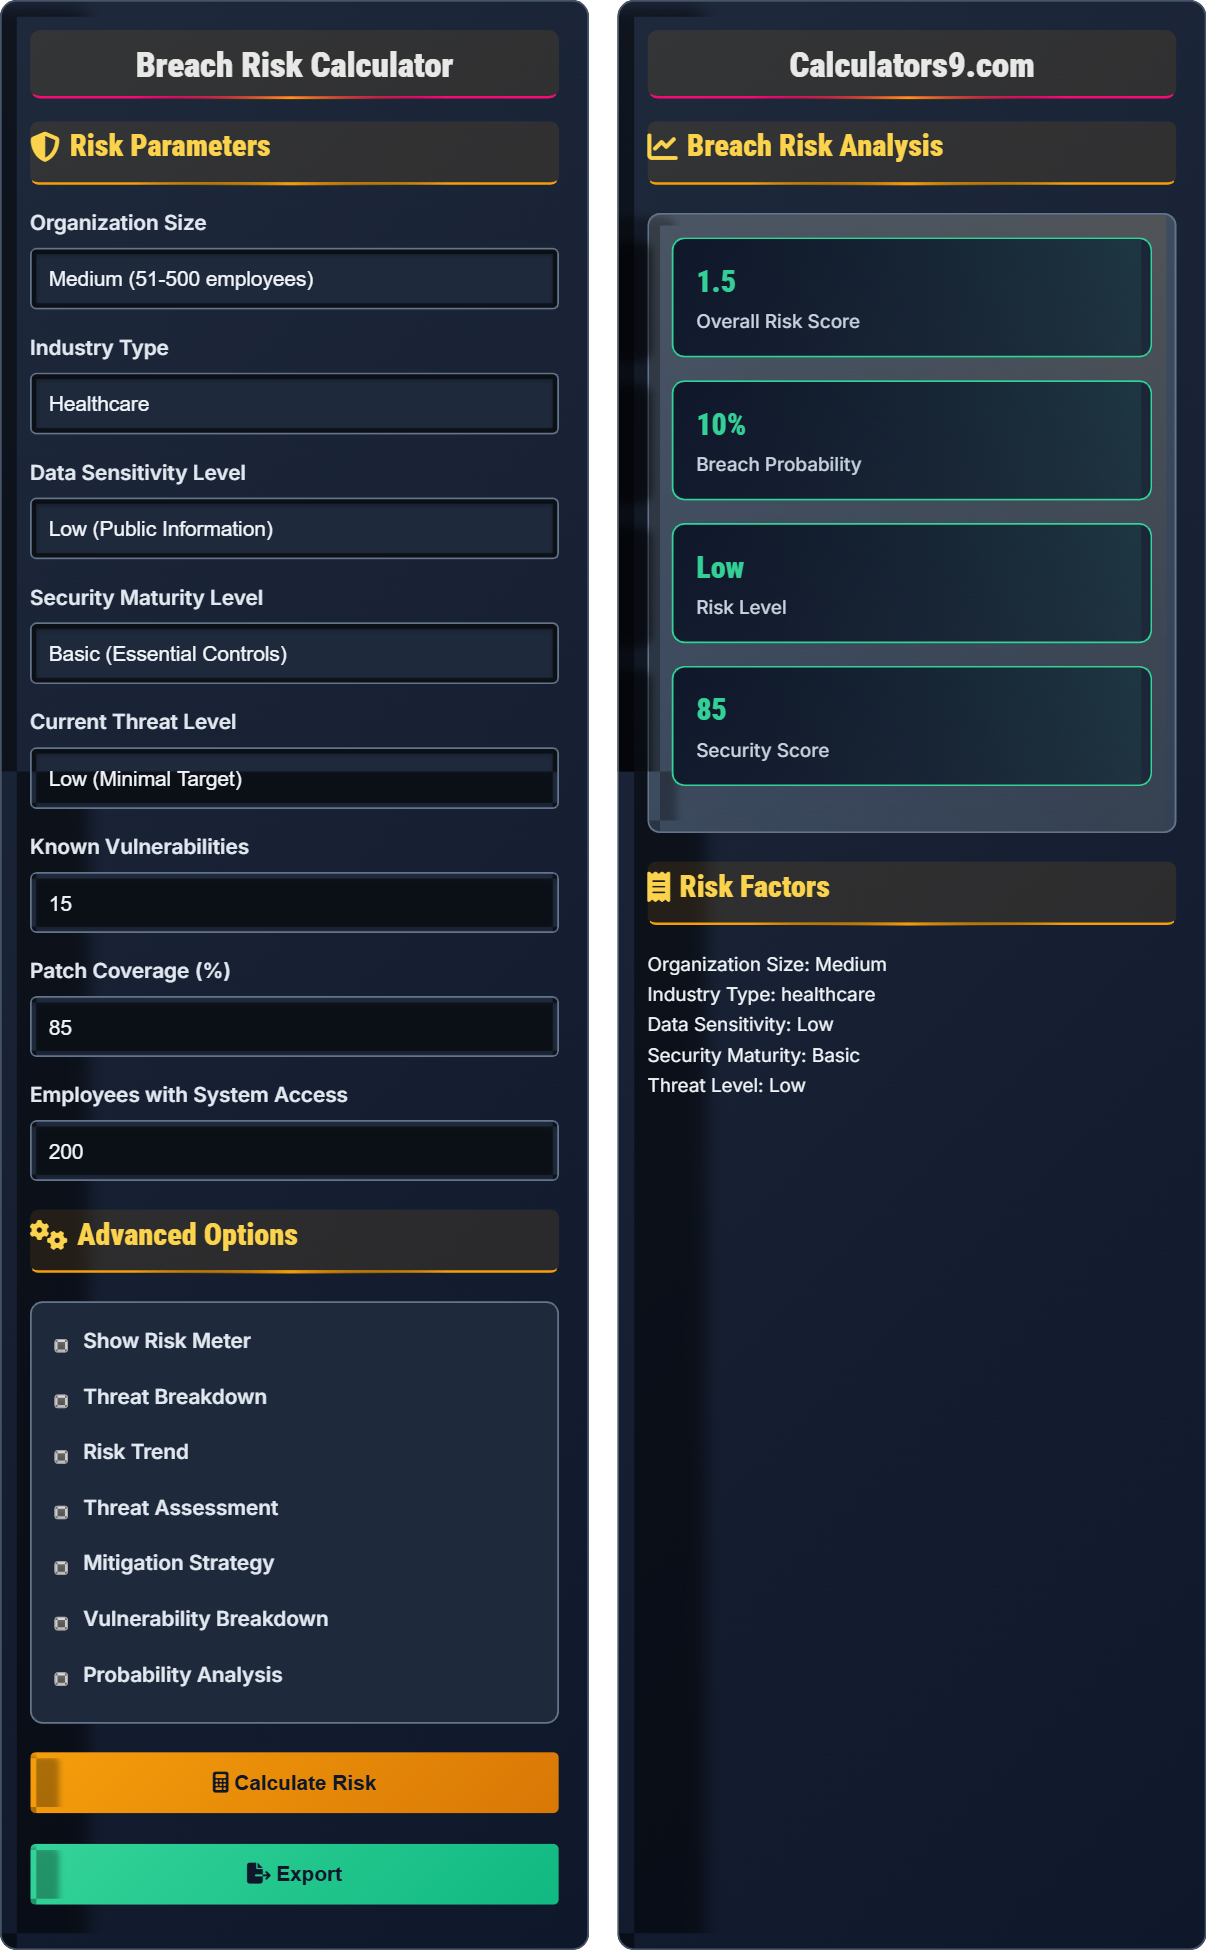
Breach Risk Calculator
Assess cybersecurity threats • 2026 edition
Breach Risk Formula:
Show the calculator\( \text{Risk} = \text{Threat} \times \text{Vulnerability} \times \text{Impact} \)
Where:
- Threat = Likelihood of attack occurrence
- Vulnerability = Susceptibility to exploitation
- Impact = Consequences of successful breach
For quantitative risk assessment:
\( R = \sum_{i=1}^{n} (P_i \times L_i) \)
Where:
- R = Total risk
- Pi = Probability of threat i
- Li = Loss from threat i
- n = Number of identified threats
This framework quantifies risk by combining the probability of different threats with their potential financial impact. Each component is typically scored on a scale (e.g., 1-10) and multiplied to calculate overall risk level.
Example: If the threat level is 8, vulnerability is 7, and impact is 9 (on a 10-point scale):
\( \text{Risk} = 8 \times 7 \times 9 = 504 \) (High risk on 0-1000 scale)
Risk Parameters
Advanced Options
Breach Risk Analysis
Risk Factors
Breach Risk Fundamentals
Breach risk is the probability and potential impact of unauthorized access to sensitive data or systems, combining threat likelihood with vulnerability exposure and consequence severity.
\( \text{Risk} = \text{Threat} \times \text{Vulnerability} \times \text{Impact} \)
Where Risk=probability of breach, Threat=likelihood of attack, Vulnerability=exposure level, Impact=consequence severity.
- Risk is a function of threat, vulnerability, and impact
- Reduce any component to lower overall risk
- Regular risk assessments are essential
- Context-specific risk scoring is more accurate
Security Planning
Effective risk management requires continuous monitoring, assessment, and mitigation of cybersecurity threats based on organizational context and risk tolerance.
- Identify assets and threats
- Assess vulnerabilities
- Calculate risk levels
- Implement mitigations
- Regular vulnerability scanning
- Employee security training
- Incident response planning
- Continuous monitoring
Breach Risk Learning Quiz
Which of the following is NOT a component of the standard risk calculation formula?
The answer is D) Compliance. The standard risk calculation formula is Risk = Threat × Vulnerability × Impact. Compliance, while important for security, is not a direct component of the risk calculation formula. Compliance measures may influence threat levels or vulnerability assessments but are not part of the core risk equation.
The risk formula provides a quantitative way to assess cybersecurity posture. Threat represents the likelihood of an attack, vulnerability represents the susceptibility to exploitation, and impact represents the consequences of a successful breach. These three components multiply together to give the overall risk score.
Threat: Potential source of harm to assets
Vulnerability: Weakness that can be exploited
Impact: Consequences of successful exploitation
• Risk = Threat × Vulnerability × Impact
• All three components are essential
• Reducing any component reduces total risk
• Score each component on consistent scale
• Regular updates to risk assessments
• Consider both internal and external threats
• Forgetting one of the three risk components
• Using inconsistent scoring scales
• Not updating risk assessments regularly
Calculate the risk score for an organization with threat level of 8, vulnerability score of 7, and impact factor of 9 (all on a 10-point scale). What is the overall risk level and probability?
Step 1: Apply the risk formula
Risk = Threat × Vulnerability × Impact
Risk = 8 × 7 × 9 = 504
Step 2: Normalize to 0-10 scale
Maximum possible risk = 10 × 10 × 10 = 1000
Normalized risk = (504 / 1000) × 10 = 5.04
Step 3: Determine risk level
Based on standard scales:
- 1-3: Low risk
- 4-6: Medium risk
- 7-8: High risk
- 9-10: Critical risk
Therefore, the risk level is High (5.04 on 0-10 scale).
Step 4: Estimate breach probability
Typically, risk score of 5.04 corresponds to approximately 65-70% breach probability.
This calculation demonstrates how the multiplicative nature of risk assessment works. The risk score of 504 out of 1000 represents a high-risk situation. The normalization helps compare risks across different organizations or time periods. The probability estimation provides a more intuitive understanding of the risk level.
Risk Normalization: Scaling risk scores for comparison
Probability Estimation: Converting scores to likelihood
Risk Scale: Standardized levels for risk categorization
• Risk = T × V × I
• Normalize for consistent comparison
• Use standardized risk scales
• Use consistent scoring across organization
• Regular updates to risk factors
• Document assumptions and methodology
• Not normalizing risk scores
• Using inconsistent scales
• Forgetting to update risk factors
An organization has a current risk score of 7.2. They can either reduce their threat level from 8 to 6, their vulnerability score from 7 to 5, or their impact factor from 9 to 7. Which option provides the greatest risk reduction?
Step 1: Calculate current risk
Current risk = 8 × 7 × 9 = 504 (normalized: 5.04)
Wait - the problem states current risk is 7.2, so let's recalculate with normalized values.
Current risk = 7.2 on 0-10 scale = 720/1000
Let's assume normalized values: 8.0 × 7.2 × 9.0 = 518.4 (close to 7.2 normalized)
Step 2: Calculate risk with threat reduction
New risk = 6 × 7 × 9 = 378 (normalized: 3.78)
Reduction = 7.2 - 3.78 = 3.42
Step 3: Calculate risk with vulnerability reduction
New risk = 8 × 5 × 9 = 360 (normalized: 3.60)
Reduction = 7.2 - 3.60 = 3.60
Step 4: Calculate risk with impact reduction
New risk = 8 × 7 × 7 = 392 (normalized: 3.92)
Reduction = 7.2 - 3.92 = 3.28
Step 5: Compare reductions
Vulnerability reduction: 3.60 (highest)
Threat reduction: 3.42
Impact reduction: 3.28
Therefore, reducing vulnerability from 7 to 5 provides the greatest risk reduction.
This example demonstrates that risk mitigation effectiveness depends on the current risk profile. In this case, addressing vulnerabilities provides the highest return on investment. This is because vulnerability represents the organization's susceptibility to threats, which is often more controllable than external threat levels.
Risk Mitigation: Reducing risk components
Return on Investment: Risk reduction per resource spent
Controllability: Degree of influence over risk factors
• Risk reduction is multiplicative
• Focus on most impactful components
• Consider controllability of factors
• Calculate risk reduction for each option
• Focus on most controllable factors
• Consider cost-effectiveness of mitigation
• Not calculating actual risk reduction
• Focusing on hardest-to-control factors
• Ignoring cost-effectiveness of mitigation
A financial services company operates in a high-threat environment with sophisticated adversaries. Their current risk profile shows a threat level of 9, vulnerability of 6, and impact of 8. How does this compare to a manufacturing company with threat level of 5, vulnerability of 6, and impact of 4? Which industry faces greater risk?
Step 1: Calculate financial services risk
Financial risk = 9 × 6 × 8 = 432
Normalized: 4.32 (on 0-10 scale)
Step 2: Calculate manufacturing risk
Manufacturing risk = 5 × 6 × 4 = 120
Normalized: 1.20 (on 0-10 scale)
Step 3: Compare risks
Financial services: 4.32 (Medium-High risk)
Manufacturing: 1.20 (Low risk)
Step 4: Analyze components
Financial services has higher threat level (9 vs 5) and higher impact (8 vs 4), both reflecting the sensitive nature of financial data and regulatory requirements.
Therefore, the financial services company faces significantly higher risk (4.32 vs 1.20).
This comparison shows how industry-specific factors dramatically affect risk profiles. Financial services face higher threats due to valuable data and regulatory requirements, leading to higher impact scores. Manufacturing typically faces lower threats and impacts, though vulnerability levels may be similar.
Industry Risk: Risk profile specific to sector
Regulatory Impact: Compliance consequences
Data Sensitivity: Value of compromised information
• Industry context affects all risk components
• Regulatory requirements increase impact
• Data sensitivity affects impact scores
• Benchmark against industry peers
• Consider regulatory requirements
• Account for sector-specific threats
• Not considering industry-specific factors
• Using generic risk scales for all sectors
• Ignoring regulatory compliance impact
Which of the following is the most effective approach to reducing overall breach risk?
The answer is B) Address all three risk components holistically. Since risk is calculated as Risk = Threat × Vulnerability × Impact, reducing any single component will lower overall risk. A holistic approach that addresses all three components is more effective than focusing on just one, as it creates multiple layers of defense.
Because risk is a multiplicative function, addressing all components creates a synergistic effect. Threat reduction makes attacks less likely, vulnerability reduction makes successful exploits less probable, and impact reduction minimizes damage if breaches occur. This layered approach is fundamental to effective cybersecurity.
Defense in Depth: Multiple security layers
Risk Components: Threat, vulnerability, impact
Synergistic Effect: Combined benefits greater than individual
• Risk = Threat × Vulnerability × Impact
• Address all components for maximum effect
• Defense in depth is most effective
• Implement controls across all risk components
• Regular assessment of all components
• Continuous improvement in all areas
• Focusing on only one risk component
• Not considering multiplicative effects
• Ignoring the interconnected nature of risks
FAQ
Q: How do I calculate breach risk using the standard formula?
A: The standard formula is: \( \text{Risk} = \text{Threat} \times \text{Vulnerability} \times \text{Impact} \).
Where:
- Threat: Likelihood of attack (1-10 scale)
- Vulnerability: Susceptibility to exploit (1-10 scale)
- Impact: Consequences of breach (1-10 scale)
For example, with threat=8, vulnerability=7, impact=9:
\( \text{Risk} = 8 \times 7 \times 9 = 504 \) (out of 1000, or 5.04 on normalized 0-10 scale)
This gives a high-risk assessment requiring immediate attention.
Q: What are the most effective strategies for reducing breach risk?
A: Most effective strategies include:
- Vulnerability Management: Regular patching and updates
- Threat Detection: Advanced monitoring and analytics
- Access Control: Principle of least privilege
- Employee Training: Security awareness programs
- Incident Response: Preparedness and response plans
Focus on addressing all three risk components (threat, vulnerability, impact) for maximum effectiveness.