Incident Response Time Calculator
Response planning & metrics • 2026 edition
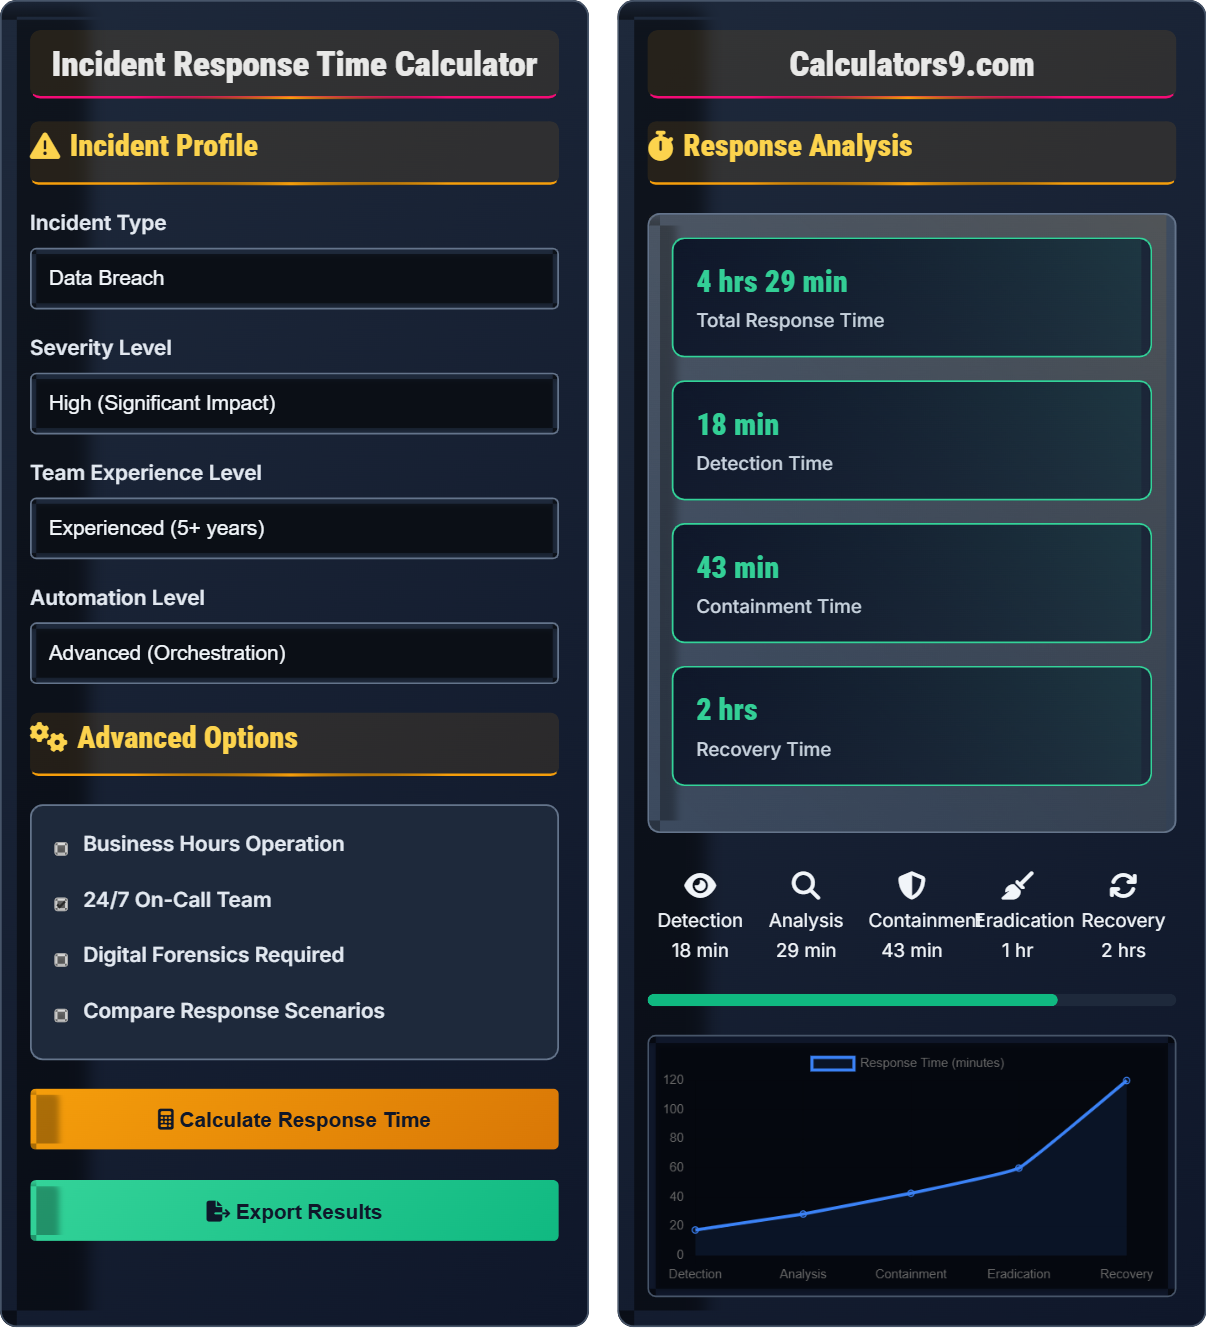
Incident Response Time Formula:
Show Calculator\( T_{total} = T_d + T_a + T_c + T_e + T_r \)
Where:
- \( T_{total} \) = Total incident response time
- \( T_d \) = Detection time (time to identify incident)
- \( T_a \) = Analysis time (time to understand scope)
- \( T_c \) = Containment time (time to isolate threat)
- \( T_e \) = Eradication time (time to remove threat)
- \( T_r \) = Recovery time (time to restore systems)
Additional factors affecting response time:
- Team experience and training level
- Availability of automated tools
- Incident severity classification
- Communication efficiency
Example: For a high-severity incident with experienced team and automation:
\( T_{total} = 15 + 30 + 45 + 60 + 120 = 270 \) minutes (4.5 hours)
The total response time would be approximately 4.5 hours.
Incident Profile
Advanced Options
Response Analysis
| Stage | Time | Efficiency |
|---|---|---|
| Detection | 15 min | High |
| Analysis | 30 min | Medium |
| Containment | 45 min | High |
Implement advanced monitoring tools
Improve threat intelligence integration
Develop faster restoration procedures
Comprehensive Incident Response Guide
Incident response is a structured methodology for addressing and managing the aftermath of a security breach or cyberattack. It involves preparing for, detecting, analyzing, containing, eradicating, and recovering from security incidents. Effective incident response minimizes damage and reduces recovery time and costs.
The total incident response time consists of five key stages:
Where:
- \(T_{total}\) = Total response time
- \(T_d\) = Detection time
- \(T_a\) = Analysis time
- \(T_c\) = Containment time
- \(T_e\) = Eradication time
- \(T_r\) = Recovery time
Several elements influence response time:
- Team Experience: More experienced teams respond faster
- Automation Level: Automated tools accelerate response
- Incident Severity: Critical incidents get priority
- Resource Availability: 24/7 staffing affects response speed
- Communication Efficiency: Clear protocols reduce delays
- Preparation: Develop and test incident response plans
- Training: Regular drills and exercises
- Tools: Invest in automated detection and response tools
- Communication: Establish clear notification chains
- Metrics: Track and improve response times
Response Fundamentals
Structured approach to managing security incidents.
\(T_{total} = T_d + T_a + T_c + T_e + T_r\)
Where T=total time, d=detection, a=analysis, c=containment, e=eradication, r=recovery.
- Preparation reduces response time
- Detection is often the longest phase
- Automation improves efficiency
Security Planning
Strategic approach to incident response preparedness.
- Identify potential incidents
- Define response procedures
- Assign roles and responsibilities
- Establish communication protocols
- Team availability
- Tool capabilities
- Regulatory requirements
- Business continuity
Incident Response Learning Quiz
Which stage of incident response involves removing the root cause of the incident and cleaning affected systems?
The answer is C) Eradication. The eradication phase is specifically focused on removing the root cause of the incident and cleaning affected systems. This involves identifying and eliminating malware, patching vulnerabilities that were exploited, removing unauthorized accounts, and ensuring that the threat actor no longer has access to the environment. This is distinct from containment (limiting spread) and recovery (restoring operations).
Students must understand the distinct phases of incident response. Detection is identifying that an incident occurred, analysis is understanding its scope, containment is limiting its spread, eradication is removing the threat, and recovery is restoring normal operations. Each phase has specific objectives and activities that build upon the previous phases.
Eradication: Removing the root cause of an incident and cleaning affected systems
Containment: Limiting the spread and impact of an incident
Recovery: Restoring normal operations after an incident
• Eradication occurs after containment
• Root cause must be eliminated to prevent recurrence
• Evidence preservation is critical during eradication
• Remember: Remove before recover
• Eradication prevents reinfection
• Document all eradication activities
• Confusing eradication with containment
• Skipping eradication and going straight to recovery
• Not addressing the root cause
Calculate the total incident response time for a high-severity incident with the following stage times: Detection (20 minutes), Analysis (35 minutes), Containment (50 minutes), Eradication (75 minutes), Recovery (3 hours). Show your work.
Using the formula: \(T_{total} = T_d + T_a + T_c + T_e + T_r\)
Given times:
- \(T_d\) = 20 minutes
- \(T_a\) = 35 minutes
- \(T_c\) = 50 minutes
- \(T_e\) = 75 minutes
- \(T_r\) = 3 hours = 180 minutes
Step 1: Convert all times to same unit (minutes)
Step 2: Sum all times = 20 + 35 + 50 + 75 + 180 = 360 minutes
Step 3: Convert to hours = 360 ÷ 60 = 6 hours
Therefore, the total response time is 6 hours.
This calculation demonstrates how response time accumulates across all phases. The recovery phase often takes the longest time, especially for complex incidents. Understanding the breakdown helps identify which phases might need improvement. The formula shows that reducing time in any phase contributes to overall response efficiency.
Total Response Time: Sum of all incident response phase durations
Time Unit Conversion: Converting between minutes and hours for calculationsPhase Accumulation: How individual phase times combine
• Always use consistent time units
• Recovery time often dominates total response time
• Each phase must be completed before moving to next
• Convert all times to same unit before adding
• Recovery phase typically takes longest
• Focus improvement efforts on longest phases
• Mixing different time units without conversion
• Forgetting to include all response phases
• Not accounting for phase dependencies
A cybersecurity team with novice experience takes 4 hours to respond to a data breach incident. An experienced team with similar tools and automation takes 2 hours for the same type of incident. If the cost of downtime is $1,000 per hour, how much does the experienced team save the organization compared to the novice team?
Novice team response time: 4 hours
Experienced team response time: 2 hours
Difference in response time: 4 - 2 = 2 hours
Cost of downtime per hour: $1,000
Cost savings: 2 hours × $1,000/hour = $2,000
Additionally, faster response typically reduces the total impact of the incident, potentially saving additional costs related to data loss, regulatory fines, and reputation damage.
This example demonstrates the significant financial impact of team experience on incident response. The 2-hour difference in response time directly translates to $2,000 in downtime savings. In practice, the benefit is often greater because faster response limits the scope of damage. This quantifies the value of investing in team training and experience.
Response Time Efficiency: How quickly incidents are resolved
Cost of Downtime: Financial impact per unit time of system unavailability
Experience Premium: Value gained from skilled personnel
• Experience significantly impacts response time
• Calculate the cost of response time differences
• Consider both direct and indirect costs
• Invest in team development for better outcomes
• Not accounting for the full financial impact of response time
• Underestimating the value of experienced staff
• Focusing only on direct costs, not indirect impacts
An organization is considering investing $50,000 in automated incident response tools. Currently, their average incident response time is 6 hours. With automation, they expect to reduce response time by 40%. If they experience 12 significant incidents per year and the average cost of downtime per incident is $10,000, calculate the ROI of the automation investment.
Current response time: 6 hours
Expected improvement: 40%
Reduced response time: 6 × (1 - 0.4) = 6 × 0.6 = 3.6 hours
Time saved per incident: 6 - 3.6 = 2.4 hours
Cost savings per incident: 2.4 hours × $10,000/hour = $24,000
Annual incidents: 12
Total annual savings: 12 × $24,000 = $288,000
Investment cost: $50,000
Net benefit: $288,000 - $50,000 = $238,000
ROI = ($238,000 ÷ $50,000) × 100 = 476%
The automation investment provides a 476% return in the first year alone.
This demonstrates the substantial ROI of security automation. The 40% reduction in response time translates to significant cost savings when multiplied across multiple incidents. This calculation shows why organizations invest heavily in Security Orchestration, Automation, and Response (SOAR) platforms. The benefits often justify the initial investment within the first year.
Security Orchestration: Automating security processes and workflows
Return on Investment (ROI): Financial benefit relative to cost
Response Time Reduction: Improvement in incident handling speed
• Automation can dramatically improve response times
• Calculate ROI across multiple incidents
• Consider both immediate and long-term benefits
• Quantify automation benefits in financial terms
• Consider incident frequency in ROI calculations
• Factor in reduced human error from automation
• Not accounting for incident frequency in ROI
• Underestimating the time-saving benefits of automation
• Focusing only on direct costs, not productivity gains
According to industry best practices, which metric is considered most critical for measuring incident response effectiveness?
The answer is C) All of the above. Both Mean Time to Detect (MTTD) and Mean Time to Respond (MTTR) are critical metrics for measuring incident response effectiveness. MTTD measures how quickly an organization detects incidents, while MTTR measures the total time from detection to resolution. Industry standards often aim for sub-10 minute detection times and under 1-hour response times for critical incidents. Both metrics are essential for comprehensive incident response measurement.
Students must understand that incident response effectiveness requires measuring multiple aspects. Detection is crucial because you can't respond to what you don't know about. Response time is important because rapid action limits damage. Together, these metrics provide a complete picture of an organization's security posture. Leading organizations track both metrics and set aggressive targets for improvement.
MTTD: Mean Time to Detect - average time to identify incidents
MTTR: Mean Time to Respond - average time to resolve incidents
Key Performance Indicator (KPI): Metric used to evaluate success
• Both detection and response times matter
• Industry standards exist for both metrics
• Continuous improvement is essential
• Track both MTTD and MTTR
• Set aggressive but achievable targets
• Benchmark against industry standards
• Focusing only on response time, not detection time
• Not setting specific targets for metrics
• Failing to track metrics over time
FAQ
Q: What are the typical response time targets for different incident severities?
A: Industry best practices recommend the following response time targets:
- Critical Incidents: Detection within 1-5 minutes, initial response within 15 minutes, containment within 1 hour
- High Priority: Detection within 10-30 minutes, initial response within 30 minutes, containment within 2 hours
- Medium Priority: Detection within 1-2 hours, response within 2-4 hours, containment within 4-8 hours
- Low Priority: Detection within 4-8 hours, response within 4-8 hours, containment within 24 hours
These targets assume mature security operations centers with 24/7 staffing and automated tools. Organizations should adjust targets based on their capabilities and business requirements. The key is to respond faster than the threat actor can cause significant damage.
Q: How can organizations improve their incident response times?
A: Organizations can improve incident response times through several strategies:
- Invest in Automation: Deploy SOAR (Security Orchestration, Automation, and Response) platforms to automate repetitive tasks
- Enhance Detection: Implement advanced monitoring with machine learning and behavioral analytics
- Train Personnel: Regular drills and tabletop exercises to maintain readiness
- Develop Playbooks: Pre-defined procedures for common incident types
- Improve Communication: Streamlined notification systems and clear escalation paths
- Regular Testing: Periodic testing of response procedures to identify bottlenecks
Studies show that organizations with mature automation capabilities can reduce response times by 50-80% compared to manual processes.