Dashboard Load Time Calculator
Optimize performance • 2026 edition
Dashboard Load Time Formula:
Show the calculator\( \text{Load Time} = \text{Network Latency} + \text{Resource Download} + \text{Processing Time} + \text{Rendering Time} \)
Where:
- Network Latency = Time for initial connection establishment
- Resource Download = Time to download all assets (HTML, CSS, JS, images)
- Processing Time = Time for script execution and data processing
- Rendering Time = Time for DOM construction and visual rendering
More specifically:
\( T_{load} = T_{latency} + \sum_{i=1}^{n} \frac{S_i}{B} + T_{processing} + T_{rendering} \)
Where:
- Tload = Total load time
- Tlatency = Network latency (seconds)
- Si = Size of resource i (bytes)
- B = Bandwidth (bytes per second)
- Tprocessing = Client-side processing time
- Trendering = Rendering time
This formula accounts for the cumulative effect of network conditions, asset sizes, and client-side processing requirements on dashboard load time.
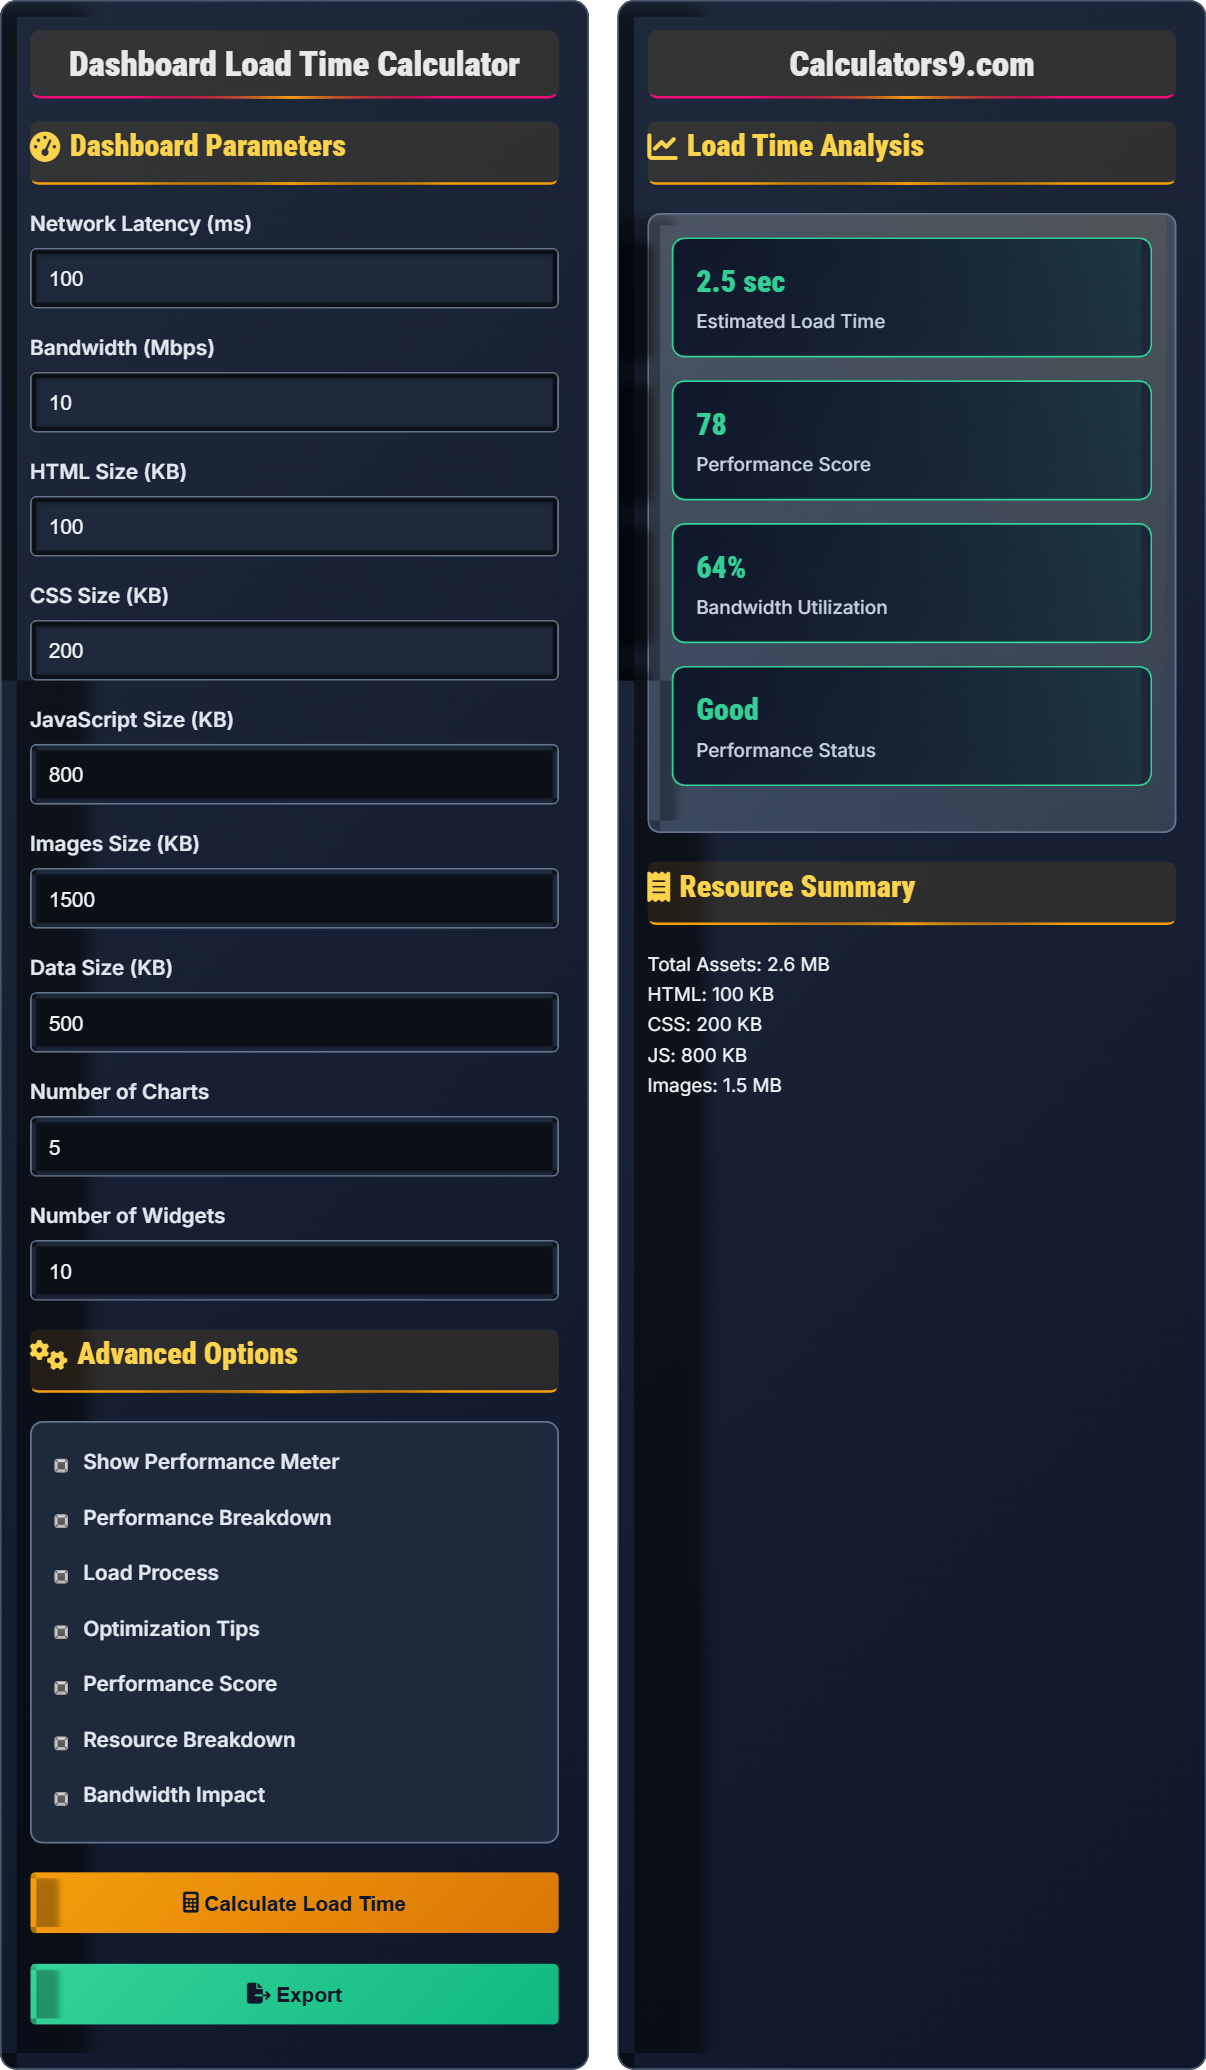
Example: With 100ms latency, 2MB total assets, 10Mbps bandwidth (1.25MB/s), 0.5s processing, 0.3s rendering:
\( T_{load} = 0.1 + \frac{2}{1.25} + 0.5 + 0.3 = 0.1 + 1.6 + 0.5 + 0.3 = 2.5 \) seconds
Dashboard Parameters
Advanced Options
Load Time Analysis
Resource Summary
Dashboard Performance Fundamentals
Dashboard load time is the total time taken for a dashboard to become fully interactive and visually complete, including network, processing, and rendering phases.
\( T_{load} = T_{latency} + \sum_{i=1}^{n} \frac{S_i}{B} + T_{processing} + T_{rendering} \)
Where Tload=total load time, Tlatency=network latency, Si=size of resource i, B=bandwidth, Tprocessing=processing time, Trendering=rendering time.
- Load time should be under 3 seconds for optimal user experience
- Image optimization can reduce load time by 30-50%
- JavaScript bundles significantly impact performance
- Caching strategies can improve subsequent loads
Performance Optimization
Key metrics include time to first byte, first contentful paint, and time to interactive for comprehensive performance assessment.
- Minimize resource sizes
- Optimize delivery mechanisms
- Reduce processing overhead
- Improve rendering efficiency
- Implement progressive loading
- Use efficient data visualization libraries
- Optimize for critical rendering path
- Implement proper caching strategies
Dashboard Performance Learning Quiz
Which component typically has the greatest impact on dashboard load time?
The answer is B) JavaScript bundle size. JavaScript typically has the greatest impact on load time because it requires parsing, compilation, and execution. Large JavaScript bundles can significantly delay the time to interactive, which is crucial for dashboard usability.
JavaScript impacts performance through multiple stages: network download, parsing, compilation, and execution. Unlike other assets that primarily affect visual rendering, JavaScript affects both the loading process and the interactive capabilities of the dashboard. Modern dashboards often include heavy visualization libraries that contribute significantly to bundle size.
JavaScript Bundle: Compiled JavaScript code for the application
Time to Interactive: When dashboard becomes fully interactive
Bundle Size: Total size of compiled JavaScript
• JavaScript affects both loading and interactivity
• Bundle size directly impacts download time
• Execution time affects rendering performance
• Implement code splitting to reduce initial bundle
• Use tree shaking to remove unused code
• Lazy load non-critical components
• Not optimizing JavaScript bundle size
• Including unnecessary visualization libraries
• Not implementing proper code splitting
Calculate the estimated load time for a dashboard with 50ms latency, 2.5MB total assets, 15Mbps bandwidth, 0.6s processing time, and 0.4s rendering time using the formula T_load = T_latency + Σ(S_i/B) + T_processing + T_rendering.
Step 1: Identify parameters
T_latency = 50ms = 0.05 seconds
Σ(S_i) = 2.5MB
B = 15Mbps = 1.875MB/s (15 ÷ 8)
T_processing = 0.6 seconds
T_rendering = 0.4 seconds
Step 2: Calculate download time
Download time = Σ(S_i)/B = 2.5MB ÷ 1.875MB/s = 1.33 seconds
Step 3: Calculate total load time
T_load = T_latency + Download time + T_processing + T_rendering
T_load = 0.05 + 1.33 + 0.6 + 0.4 = 2.38 seconds
Therefore, the estimated load time is 2.38 seconds.
This calculation demonstrates how each component contributes to the total load time. The formula shows that load time is additive across different phases, with bandwidth and asset size having a direct proportional relationship to download time. The calculation also shows how processing and rendering times are independent of network conditions.
Network Latency: Time for initial connection establishment
Bandwidth: Data transfer rate capacity
Processing Time: Client-side computation time
• Load time is the sum of all components
• Bandwidth affects download time proportionally
• Processing time is independent of network
• Convert bandwidth from Mbps to MB/s (divide by 8)
• Consider compression ratios for actual sizes
• Factor in CDN performance improvements
• Forgetting to convert Mbps to MB/s
• Not accounting for compression ratios
• Assuming linear relationship between all components
A dashboard currently loads in 4.5 seconds with 1MB of images. Image optimization could reduce the image size by 60%. If the current bandwidth is 8Mbps, how much time would be saved through image optimization?
Step 1: Calculate current download time for images
Current image size = 1MB
Bandwidth = 8Mbps = 1MB/s
Current image download time = 1MB ÷ 1MB/s = 1 second
Step 2: Calculate optimized image size
Reduction = 60%
Optimized size = 1MB × (1 - 0.60) = 0.4MB
Step 3: Calculate optimized download time
Optimized download time = 0.4MB ÷ 1MB/s = 0.4 seconds
Step 4: Calculate time saved
Time saved = 1.0 - 0.4 = 0.6 seconds
Therefore, image optimization would save 0.6 seconds of load time.
This example demonstrates the quantifiable impact of image optimization. The calculation shows how a 60% reduction in image size translates to a proportional reduction in download time. This type of analysis helps prioritize optimization efforts based on the expected time savings.
Image Optimization: Reducing file size while maintaining quality
Compression Ratio: Reduction in file size
Time Savings: Reduction in load time from optimization
• Image optimization has proportional time savings
• Bandwidth determines download time
• Compression affects download time directly
• Prioritize largest assets for optimization
• Use WebP format for better compression
• Implement responsive images for different devices
• Not considering actual bandwidth available
• Ignoring compression ratios in calculations
• Not prioritizing largest assets first
A dashboard has 200ms server response time and 3MB of assets. Using a CDN reduces the effective latency to 50ms and improves bandwidth to 20Mbps. Calculate the load time improvement from using a CDN, assuming 0.5s processing time and 0.3s rendering time.
Without CDN:
Latency = 200ms = 0.2s
Assets = 3MB
Bandwidth = assume 10Mbps = 1.25MB/s
Download time = 3MB ÷ 1.25MB/s = 2.4s
Total load time = 0.2 + 2.4 + 0.5 + 0.3 = 3.4s
With CDN:
Latency = 50ms = 0.05s
Assets = 3MB
Bandwidth = 20Mbps = 2.5MB/s
Download time = 3MB ÷ 2.5MB/s = 1.2s
Total load time = 0.05 + 1.2 + 0.5 + 0.3 = 2.05s
Improvement:
Time saved = 3.4 - 2.05 = 1.35s
Percentage improvement = (1.35 ÷ 3.4) × 100% = 39.7%
Therefore, CDN implementation saves 1.35 seconds (39.7% improvement).
This example shows how CDNs improve performance through reduced latency and increased bandwidth. The calculation demonstrates both the network improvements and the cumulative effect on total load time. CDNs provide geographic distribution that reduces the physical distance data must travel.
CDN: Content Delivery Network for distributed content
Geographic Distribution: Servers located near users
Latency Reduction: Decreased time for initial connections
• CDNs reduce both latency and improve bandwidth
• Geographic proximity affects latency
• Bandwidth improvements are proportional
• Use CDN for static assets primarily
• Consider global distribution for worldwide users
• Monitor CDN performance regularly
• Not considering CDN costs vs. benefits
• Assuming CDN helps with all components equally
• Not measuring actual performance improvements
Which of the following has the greatest impact on the critical rendering path?
The answer is B) CSS delivery optimization. CSS is render-blocking, meaning the browser cannot render content until CSS is downloaded and processed. Optimizing CSS delivery (inlining critical CSS, deferring non-critical styles) has the greatest impact on the critical rendering path.
The critical rendering path is the sequence of steps required to convert HTML, CSS, and JavaScript into pixels on the screen. CSS is render-blocking by design, so optimizing its delivery is crucial for fast initial rendering. While other optimizations are important, CSS delivery directly affects when users see content.
Critical Rendering Path: Steps from HTML/CSS to screen rendering
Render-Blocking: Resources that delay rendering
Critical CSS: Styles needed for above-the-fold content
• CSS is render-blocking by default
• Critical CSS should be inlined
• Non-critical CSS should be deferred
• Inline critical CSS for fastest rendering
• Defer non-critical CSS loading
• Use media queries to optimize CSS loading
• Not prioritizing critical CSS optimization
• Including all CSS upfront instead of deferring
• Not considering CSS dependency chains
FAQ
Q: How do I calculate dashboard load time?
A: The formula is: \( T_{load} = T_{latency} + \sum_{i=1}^{n} \frac{S_i}{B} + T_{processing} + T_{rendering} \).
Where:
- Tload = Total load time
- Tlatency = Network latency
- Si = Size of resource i
- B = Bandwidth
- Tprocessing = Client processing time
- Trendering = Rendering time
For example, with 100ms latency, 2MB assets, 10Mbps bandwidth (1.25MB/s), 0.5s processing, 0.3s rendering:
\( T_{load} = 0.1 + \frac{2}{1.25} + 0.5 + 0.3 = 2.5 \) seconds.
Q: What are the most effective dashboard performance optimizations?
A: Most effective optimizations include:
- Image optimization: Reduce file sizes by 30-50%
- CSS optimization: Inline critical CSS, defer others
- JavaScript bundling: Code splitting and tree shaking
- CDN usage: Reduce latency and improve bandwidth
- Caching: Browser and server-side caching
Focus on the largest assets first for maximum impact.