Data Cleaning Time Estimator
Optimize data preparation • 2026 edition
Data Cleaning Time Formula:
Show the calculator\( \text{Cleaning Time} = \text{Base Time} \times \text{Complexity Multiplier} \times \text{Data Volume Factor} \)
Where:
- Base Time = Standard time for basic cleaning operations
- Complexity Multiplier = Factor based on data quality issues
- Data Volume Factor = Scaling factor based on dataset size
More specifically:
\( T = B \times (1 + \sum_{i=1}^{n} w_i \times s_i) \times \log(N) \)
Where:
- T = Total cleaning time
- B = Base time per record
- wi = Weight of issue type i
- si = Severity of issue type i
- N = Number of records
This formula accounts for the exponential increase in complexity with data volume and the multiplicative effect of multiple data quality issues.
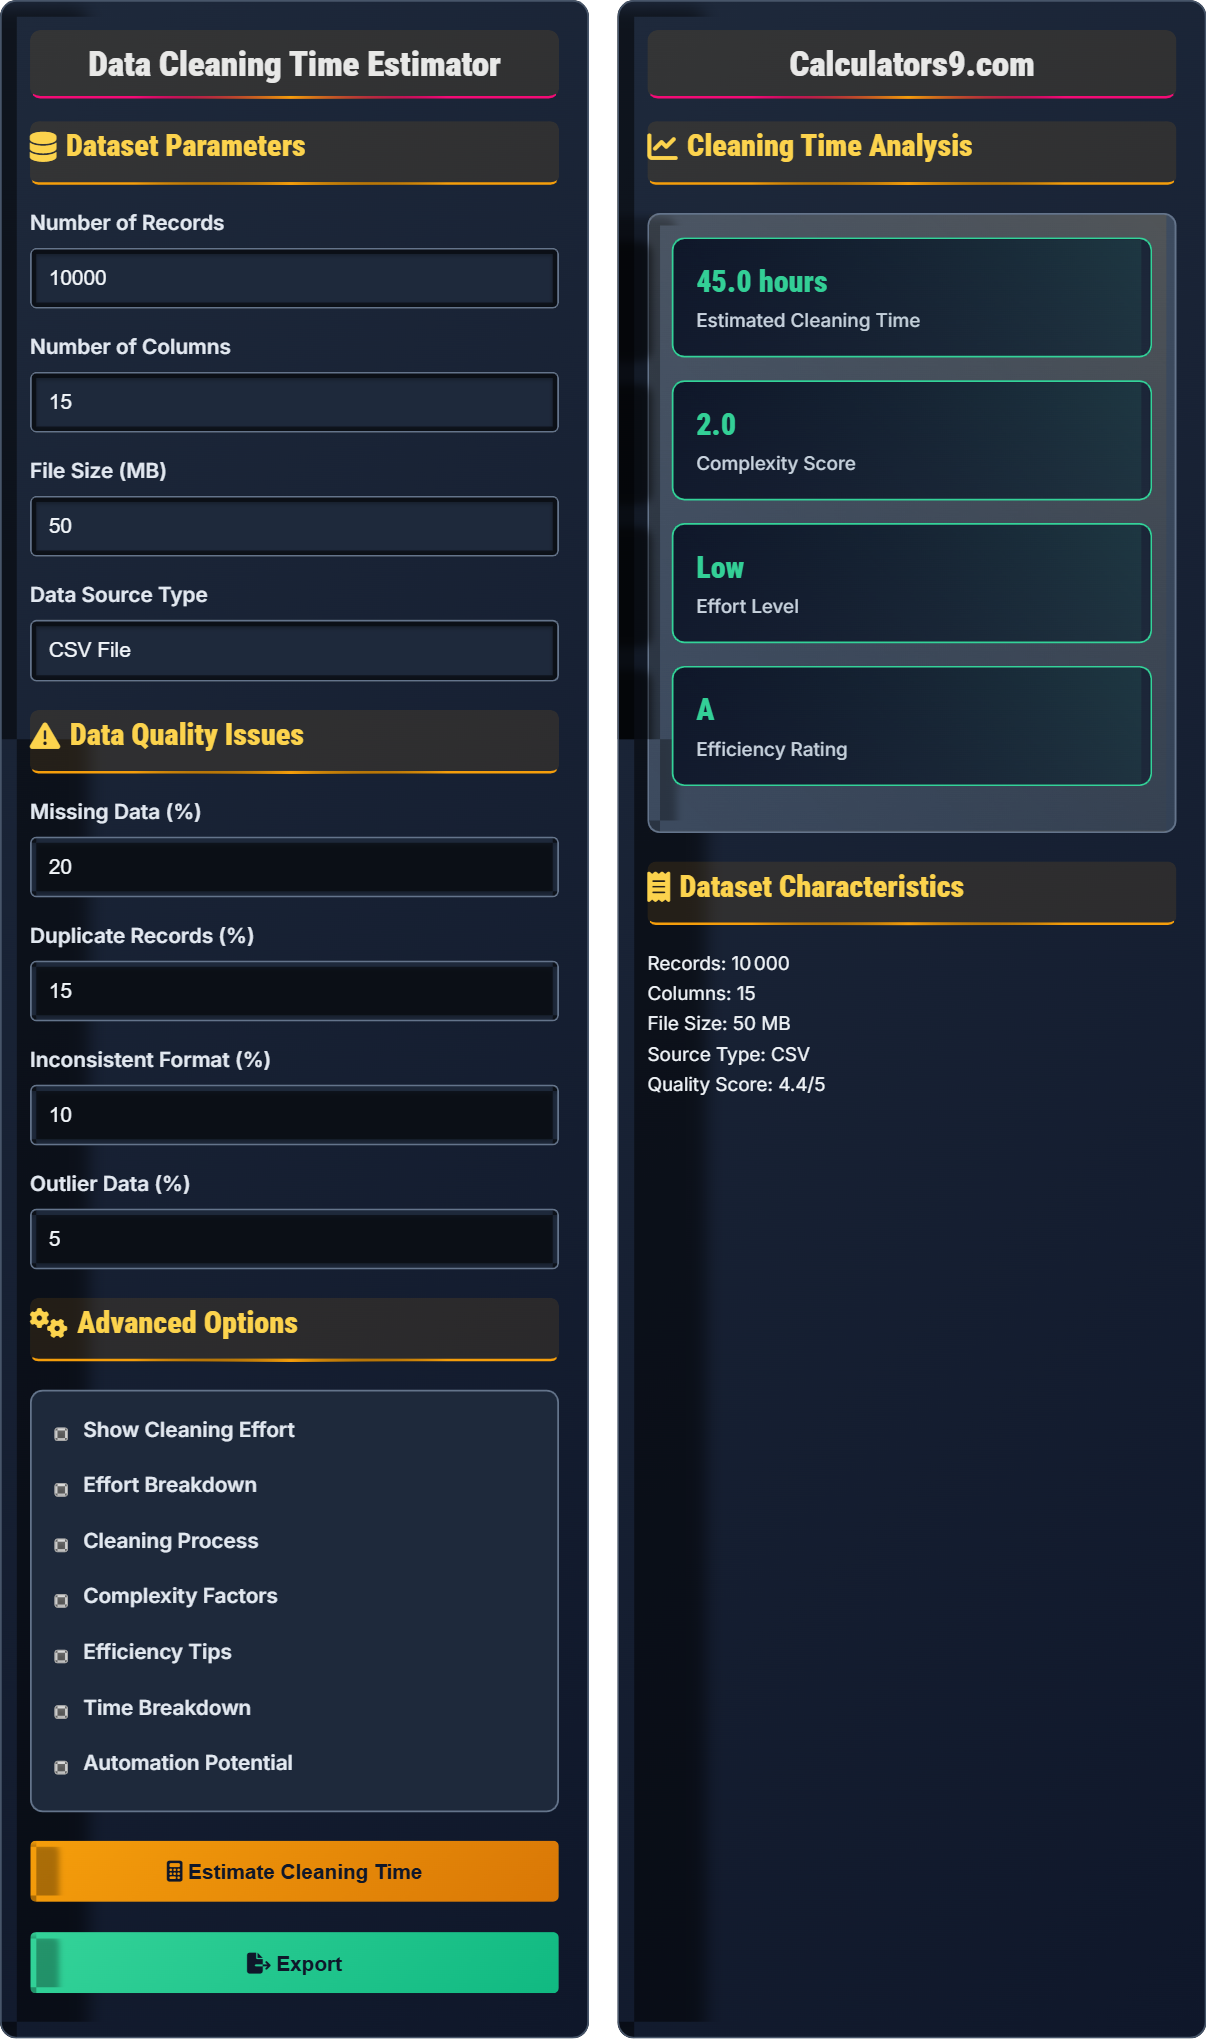
Example: For 10,000 records with 20% missing values (w=0.3, s=0.2), 15% duplicates (w=0.2, s=0.15), and base time of 0.001 hours per record:
\( T = 0.001 \times 10000 \times (1 + 0.3 \times 0.2 + 0.2 \times 0.15) \times \log(10000) \)
\( T = 10 \times (1 + 0.06 + 0.03) \times 4 = 10 \times 1.09 \times 4 = 43.6 \) hours
Dataset Parameters
Data Quality Issues
Advanced Options
Cleaning Time Analysis
Dataset Characteristics
Data Cleaning Fundamentals
Data cleaning is the process of identifying and correcting errors, inconsistencies, and inaccuracies in datasets to improve data quality and reliability.
\( T = B \times (1 + \sum_{i=1}^{n} w_i \times s_i) \times \log(N) \)
Where T=total time, B=base time, wᵢ=weight of issue i, sᵢ=severity of issue i, N=number of records.
- Data cleaning typically takes 60-80% of project time
- Quality issues compound complexity exponentially
- Automation potential varies by issue type
- Documentation is crucial for reproducibility
Quality Assessment
Key metrics include completeness, accuracy, consistency, and validity of data elements.
- Completeness: Percentage of non-null values
- Accuracy: Correctness of values
- Consistency: Uniformity across records
- Validity: Adherence to business rules
- Assess data quality before cleaning
- Prioritize critical issues first
- Validate results after cleaning
- Document all transformations
Data Cleaning Learning Quiz
Which of the following has the greatest impact on data cleaning time?
The answer is B) Quality of the data. While volume affects cleaning time, poor data quality with missing values, duplicates, and inconsistencies has an exponential impact on cleaning effort. A small dataset with severe quality issues can take longer to clean than a large, clean dataset.
Data cleaning complexity is driven more by the number and severity of quality issues than by raw data volume. Poor quality data requires more manual intervention, validation, and iterative cleaning processes, which scales exponentially with issue complexity rather than linearly with volume.
Data Quality: Extent to which data meets quality criteria
Complexity Scaling: How effort increases with issue severity
Quality Issues: Problems affecting data integrity
• Quality issues compound complexity exponentially
• Poor data quality requires more manual effort
• Assessment should precede cleaning
• Assess data quality before estimating time
• Prioritize issues with greatest impact
• Plan for iterative cleaning processes
• Assuming time scales linearly with volume
• Not accounting for data quality issues
• Underestimating manual intervention needs
Calculate the estimated cleaning time for a dataset with 50,000 records, 20 columns, 25% missing values, and 10% duplicates using the formula T = B × (1 + Σwᵢ × sᵢ) × log(N), where B = 0.001 hours per record, w_missing = 0.3, w_duplicates = 0.2.
Step 1: Identify parameters
B = 0.001 hours/record
N = 50,000 records
w_missing = 0.3
s_missing = 0.25
w_duplicates = 0.2
s_duplicates = 0.10
Step 2: Calculate complexity factor
Σwᵢ × sᵢ = (0.3 × 0.25) + (0.2 × 0.10) = 0.075 + 0.02 = 0.095
Step 3: Calculate logarithmic factor
log(N) = log(50,000) = log(5 × 10⁴) = log(5) + 4 = 0.699 + 4 = 4.699
Step 4: Calculate total time
T = 0.001 × 50,000 × (1 + 0.095) × 4.699
T = 50 × 1.095 × 4.699 = 257.2 hours
Therefore, the estimated cleaning time is 257.2 hours.
This calculation demonstrates how multiple quality issues combine multiplicatively to affect cleaning time. The logarithmic factor accounts for the fact that cleaning efficiency often improves with larger datasets as patterns become more apparent, but the complexity multiplier captures the exponential impact of quality issues.
Base Time: Standard time per record for basic operations
Weight: Relative importance of issue type
Severity: Extent of issue presence in data
• Multiple issues combine multiplicatively
• Logarithmic scaling for volume effects
• Weights reflect issue complexity
• Use weighted factors for different issue types
• Apply logarithmic scaling for large datasets
• Validate estimates with historical data
• Not accounting for multiple simultaneous issues
• Assuming linear scaling with volume
• Using uniform weights for all issue types
A data scientist estimates that 80% of missing value imputation can be automated, 90% of duplicate detection can be automated, and 70% of format standardization can be automated. If the total cleaning time is 100 hours, how much time can be saved through automation?
Step 1: Calculate time allocation
Assuming equal distribution across tasks: 33.3 hours each
Step 2: Calculate automatable time per task
Missing values: 33.3 × 0.80 = 26.64 hours
Duplicates: 33.3 × 0.90 = 30.0 hours
Formatting: 33.3 × 0.70 = 23.3 hours
Step 3: Calculate total automatable time
26.64 + 30.0 + 23.3 = 79.9 hours
Step 4: Calculate time savings
Time saved = 79.9 hours
Remaining manual work = 100 - 79.9 = 20.1 hours
Therefore, 79.9 hours can be saved through automation.
This example shows the importance of identifying automation opportunities in data cleaning workflows. By focusing automation efforts on tasks with high automation potential, data scientists can significantly reduce manual effort and improve efficiency.
Automation Potential: Percentage of task that can be automated
Time Savings: Manual effort eliminated through automation
Efficiency Gain: Improvement from automation
• Focus automation on high-impact tasks
• Calculate automation potential per task
• Consider ROI of automation investments
• Prioritize tasks with highest automation potential
• Build reusable cleaning pipelines
• Document automation rules for maintenance
• Not quantifying automation potential
• Over-investing in low-impact automation
• Ignoring maintenance costs of automation
A dataset has 10,000 records with the following quality issues: 15% missing values, 8% duplicates, 12% inconsistent formats, and 3% outliers. Calculate the overall quality score if perfect quality is 100 and each issue type contributes equally to the quality penalty.
Step 1: Calculate total quality penalty
Missing values: 15%
Duplicates: 8%
Inconsistent formats: 12%
Outliers: 3%
Total penalty = 15 + 8 + 12 + 3 = 38%
Step 2: Calculate quality score
Quality score = 100 - Total penalty
Quality score = 100 - 38 = 62%
Step 3: Classify quality level
62% quality score indicates "Medium" quality data requiring significant cleaning effort.
Therefore, the overall quality score is 62%.
This calculation provides a simple metric for data quality assessment. The quality score helps estimate cleaning effort and prioritize datasets for processing. Higher quality scores indicate cleaner data requiring less intervention.
Quality Score: Metric representing overall data quality
Quality Penalty: Reduction from perfect quality
Quality Classification: Categorization of data quality level
• Quality score = 100 - sum of penalties
• Higher scores indicate better quality
• Use for prioritization decisions
• Use quality scores for project prioritization
• Set quality thresholds for acceptance
• Track quality improvements over time
• Not accounting for all quality dimensions
• Using equal weighting without justification
• Ignoring impact of quality on downstream processes
Which of the following is the most effective strategy for managing data cleaning time?
The answer is B) Focus on automation and reusable scripts. Automation provides the best long-term return on investment by reducing manual effort and enabling faster processing of similar datasets. Reusable scripts improve efficiency and consistency across projects.
Effective resource management in data cleaning relies on process optimization rather than simply adding resources. Automation and reusable components provide scalable solutions that improve with each iteration, unlike brute-force approaches that don't scale efficiently.
Process Optimization: Improving efficiency through systematic changes
Scalable Solutions: Approaches that work for different volumes
Resource Management: Efficient allocation of time and personnel
• Automation provides long-term benefits
• Process improvements scale better than resources
• Validation prevents downstream errors
• Invest in automation tools and scripts
• Create standardized cleaning workflows
• Build validation into cleaning processes
• Treating each dataset as unique without automation
• Not documenting cleaning processes
• Skipping validation to save time (creates more work)
FAQ
Q: How do I estimate data cleaning time for a new project?
A: The formula is: \( T = B \times (1 + \sum_{i=1}^{n} w_i \times s_i) \times \log(N) \).
Where:
- T = Total cleaning time
- B = Base time per record (typically 0.001-0.005 hours)
- wi = Weight of issue type i
- si = Severity of issue type i
- N = Number of records
For example, with 10,000 records, 20% missing values (w=0.3, s=0.2), and base time of 0.001:
\( T = 0.001 \times 10000 \times (1 + 0.3 \times 0.2) \times \log(10000) = 10 \times 1.06 \times 4 = 42.4 \) hours.
Q: What are the most common data quality issues and their impact?
A: Common data quality issues and their typical impact:
- Missing Values: 15-30% of cleaning time, high impact on analysis
- Duplicates: 10-20% of cleaning time, affects aggregation
- Format Inconsistencies: 10-15% of cleaning time, impacts processing
- Outliers: 5-10% of cleaning time, affects statistical measures
- Invalid Values: 5-15% of cleaning time, impacts accuracy
Address these issues in priority order based on their impact on your specific analysis goals.