Outlier Detection Calculator
Identify data anomalies • 2026 edition
Outlier Detection Formulas:
Show the calculatorIQR Method:
\( \text{Q1} = \text{First Quartile} \)
\( \text{Q3} = \text{Third Quartile} \)
\( \text{IQR} = \text{Q3} - \text{Q1} \)
\( \text{Lower Bound} = \text{Q1} - 1.5 \times \text{IQR} \)
\( \text{Upper Bound} = \text{Q3} + 1.5 \times \text{IQR} \)
\( \text{Outliers} = \text{Values} < \text{Lower Bound} \text{ or } > \text{Upper Bound} \)
Z-Score Method:
\( z = \frac{x - \mu}{\sigma} \)
\( \text{Outliers} = |z| > 3 \)
Where:
- Q1 = First quartile (25th percentile)
- Q3 = Third quartile (75th percentile)
- IQR = Interquartile range
- μ = Mean of the dataset
- σ = Standard deviation
- z = Z-score
These methods identify data points that deviate significantly from the central tendency. The IQR method is robust to outliers, while the Z-score method assumes normal distribution.
Example: Dataset: [1, 2, 3, 4, 5, 100]
Q1 = 2, Q3 = 5, IQR = 3, Bounds = [-2.5, 9.5], Outlier = 100
Mean = 19.17, Std Dev = 37.42, Z-score of 100 = 2.17 (not outlier at 3σ)
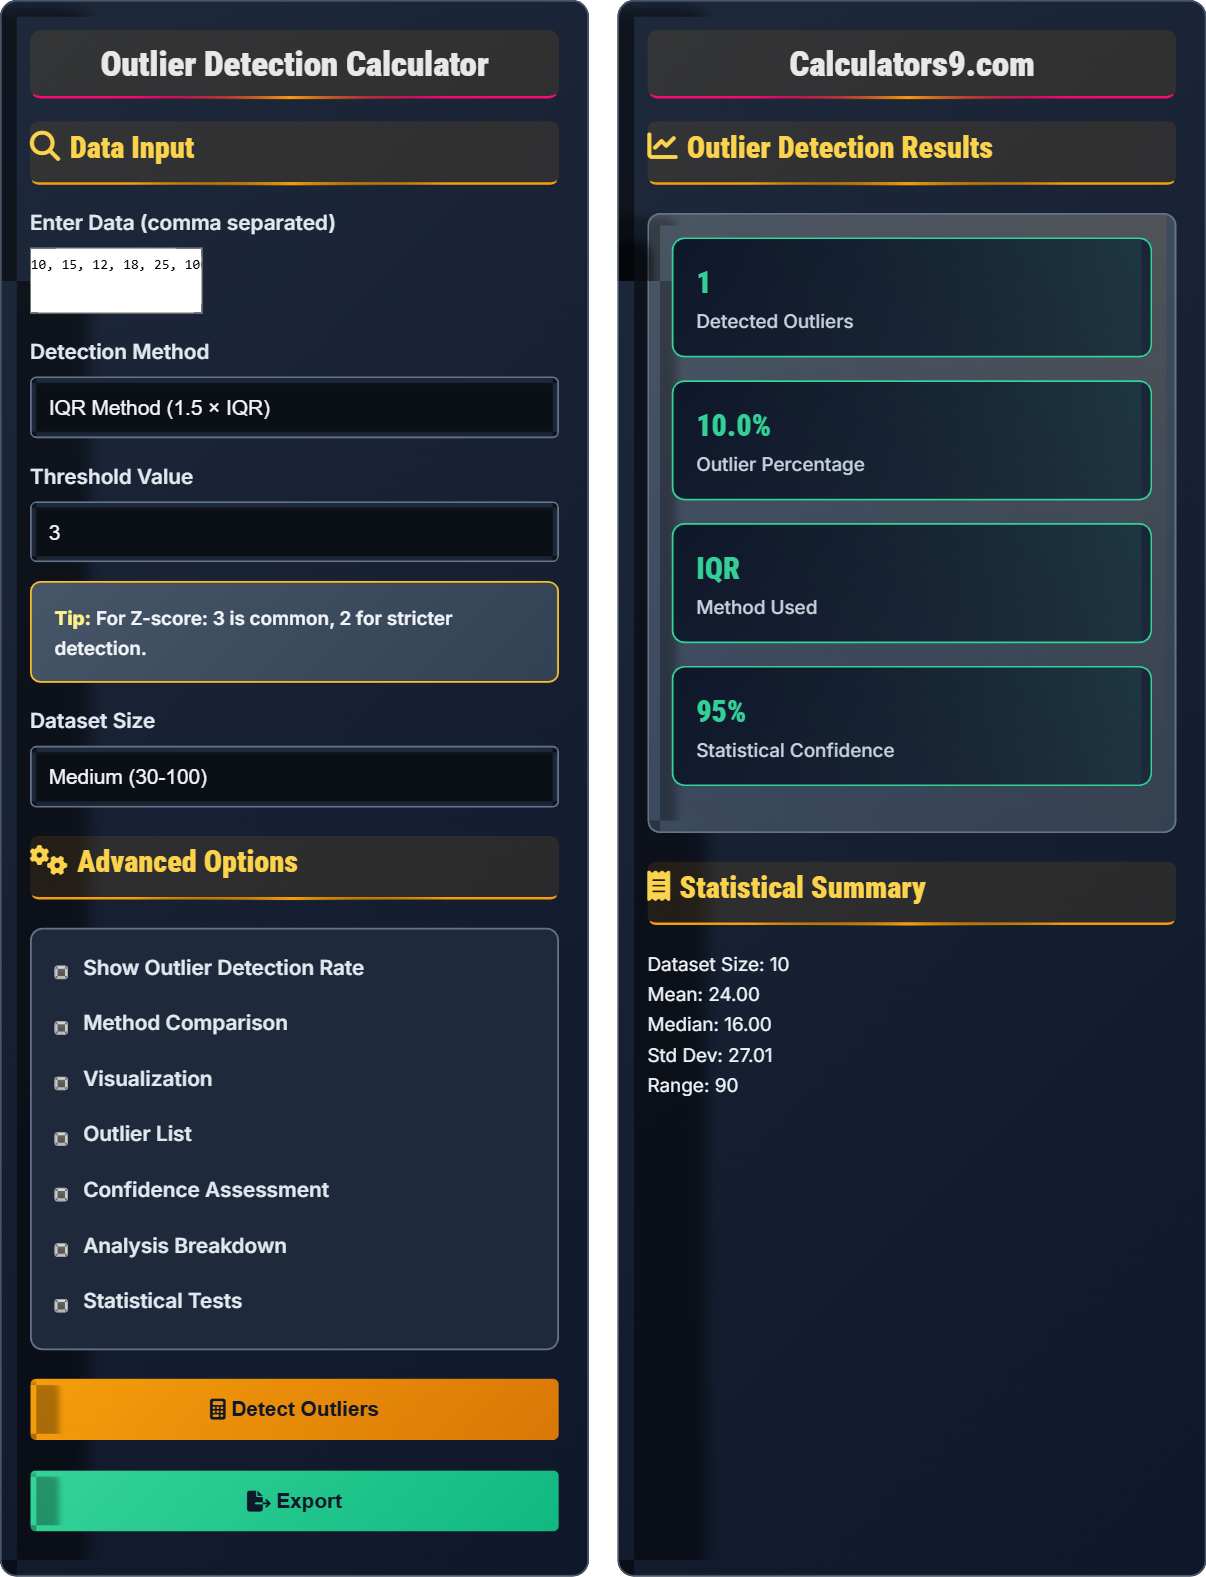
Data Input
Advanced Options
Outlier Detection Results
Statistical Summary
Outlier Detection Fundamentals
Outliers are data points that significantly deviate from the rest of the dataset. They can indicate variability, measurement errors, or novel phenomena.
\( \text{Lower Bound} = Q1 - 1.5 \times \text{IQR} \)
\( \text{Upper Bound} = Q3 + 1.5 \times \text{IQR} \)
Where IQR=Q3-Q1, Q1=first quartile, Q3=third quartile.
- Outliers may indicate errors or genuine anomalies
- Choose detection method based on data distribution
- Consider impact on analysis before removal
- Document outlier handling decisions
Detection Methods
Different methods suit different data characteristics: IQR for skewed distributions, Z-score for normal distributions.
- IQR: Robust, resistant to outliers
- Z-Score: Assumes normal distribution
- Modified Z: Uses median absolute deviation
- Tukey: Stricter than standard IQR
- Visualize data before detection
- Use multiple methods for validation
- Consider domain knowledge
- Document all decisions
Outlier Detection Learning Quiz
Which outlier detection method is most appropriate for a dataset with a skewed distribution?
The answer is B) IQR method. The IQR method is robust to outliers and does not assume a normal distribution, making it ideal for skewed data. The Z-score method assumes normal distribution and can be heavily influenced by outliers in skewed datasets.
Understanding the assumptions of different outlier detection methods is crucial. The IQR method uses quartiles, which are rank-based measures, making them resistant to extreme values. In contrast, the Z-score method uses mean and standard deviation, which are sensitive to outliers, especially in skewed distributions.
Skewed Distribution: Asymmetric distribution with tail on one side
Robust Statistics: Statistics resistant to outliers
Quartiles: Values dividing data into four equal parts
• IQR method is robust to outliers
• Z-score assumes normal distribution
• Match method to data characteristics
• Visualize data distribution before choosing method
• Use IQR for skewed or heavy-tailed distributions
• Use Z-score for normally distributed data
• Using Z-score for skewed distributions
• Not considering data distribution shape
• Applying normal distribution methods to non-normal data
Calculate the IQR bounds for the dataset [1, 2, 3, 4, 5, 6, 7, 8, 9, 100] and identify any outliers using the standard IQR method.
Step 1: Order the data
[1, 2, 3, 4, 5, 6, 7, 8, 9, 100]
Step 2: Calculate quartiles
Position of Q1 = (n+1)/4 = (10+1)/4 = 2.75
Q1 = 2 + 0.75(3-2) = 2.75
Position of Q3 = 3(n+1)/4 = 3(10+1)/4 = 8.25
Q3 = 8 + 0.25(9-8) = 8.25
Step 3: Calculate IQR
IQR = Q3 - Q1 = 8.25 - 2.75 = 5.5
Step 4: Calculate bounds
Lower Bound = Q1 - 1.5×IQR = 2.75 - 1.5×5.5 = -5.5
Upper Bound = Q3 + 1.5×IQR = 8.25 + 1.5×5.5 = 16.5
Step 5: Identify outliers
Any value < -5.5 or > 16.5 is an outlier
Only 100 > 16.5, so 100 is the outlier.
This calculation demonstrates how the IQR method identifies outliers using quartiles. The method is robust because it uses rank-based measures (quartiles) rather than mean and standard deviation. The 1.5 factor is a standard convention that balances sensitivity and specificity in outlier detection.
Interquartile Range: Difference between third and first quartiles
Quartile Calculation: Position-based interpolation
Outlier Bounds: Thresholds for identifying outliers
• IQR = Q3 - Q1
• Lower Bound = Q1 - 1.5×IQR
• Upper Bound = Q3 + 1.5×IQR
• Use 1.5 for standard outlier detection
• Use 3.0 for extreme outlier detection
• Interpolate between values for fractional positions
• Incorrectly calculating quartile positions
• Forgetting to multiply IQR by 1.5
• Not interpolating for fractional positions
A dataset has a mean of 50 and standard deviation of 10. Using the Z-score method with a threshold of 2, determine if the value 75 is an outlier. What about with a threshold of 3?
Step 1: Calculate Z-score
Z = (x - μ) / σ = (75 - 50) / 10 = 25 / 10 = 2.5
Step 2: Compare with threshold of 2
|Z| = 2.5 > 2, so 75 is an outlier at threshold 2
Step 3: Compare with threshold of 3
|Z| = 2.5 < 3, so 75 is NOT an outlier at threshold 3
Therefore, 75 is an outlier with threshold 2 but not with threshold 3.
This example shows how the threshold value affects outlier detection. Lower thresholds (like 2) are more sensitive and detect more outliers, while higher thresholds (like 3) are more conservative. The choice of threshold depends on the acceptable false positive rate and the application requirements.
Z-Score: Standardized score indicating standard deviations from mean
Threshold: Critical value for outlier classification
Sensitivity: Ability to detect true outliers
• Z = (x - μ) / σ
• Outlier if |Z| > threshold
• Lower threshold = more sensitive detection
• Use 2 for sensitive detection
• Use 3 for standard detection
• Consider application-specific requirements
• Not taking absolute value of Z-score
• Using incorrect threshold values
• Not considering data distribution assumptions
A dataset has extreme outliers that are affecting the mean and standard deviation. Which outlier detection method would be more appropriate: Z-score or IQR? Explain your reasoning and provide the mathematical justification.
Appropriate Method: IQR method
Reasoning:
The IQR method is more appropriate because:
1. It uses quartiles (rank-based measures) which are robust to outliers
2. The Z-score method uses mean and standard deviation which are sensitive to outliers
Mathematical Justification:
For Z-score: Z = (x - μ) / σ
Extreme outliers increase both μ and σ, reducing the Z-scores of all points
This makes it harder to detect outliers using Z-score when they are already present
For IQR: Uses Q1 and Q3 which are not affected by extreme values beyond them
Q1 and Q3 depend only on the middle 50% of the data
This makes IQR robust to extreme outliers
Therefore, IQR is preferred for datasets with existing extreme outliers.
This example demonstrates the concept of robustness in statistics. The IQR method is robust because it's based on ranks rather than magnitudes, making it resistant to extreme values. This is particularly important when the dataset already contains outliers that could distort parametric measures like mean and standard deviation.
Robust Statistics: Statistics insensitive to outliers
Parametric Measures: Statistics based on parameters like mean/SD
Rank-Based Measures: Statistics based on data ordering
• IQR is robust to outliers
• Z-score is sensitive to outliers
• Choose method based on data characteristics
• Use IQR when outliers are suspected
• Use Z-score for clean, normally distributed data
• Consider modified Z-score for robust parametric detection
• Using Z-score when dataset contains outliers
• Not considering the impact of outliers on statistics
• Assuming all methods work equally well for all data
What is the primary advantage of the Modified Z-Score over the standard Z-Score for outlier detection?
The answer is B) It is more robust to outliers. The Modified Z-Score uses the Median Absolute Deviation (MAD) instead of standard deviation, and the median instead of mean. Both median and MAD are robust statistics that are not affected by extreme values, making the Modified Z-Score more reliable when outliers are present.
The Modified Z-Score formula is: \( M_i = \frac{0.6745(x_i - \tilde{x})}{\text{MAD}} \) where \(\tilde{x}\) is the median and MAD is the median absolute deviation. This approach combines the standardized scoring concept of Z-score with the robustness of rank-based measures.
Modified Z-Score: Z-score using median and MAD
Median Absolute Deviation: Median of absolute deviations from median
Robust Statistics: Statistics resistant to outliers
• Modified Z-score uses median and MAD
• More robust than standard Z-score
• Better for datasets with outliers
• Use Modified Z-score when outliers are suspected
• Standard threshold is 3.5 for Modified Z-score
• Combines benefits of parametric and non-parametric methods
• Confusing Modified Z-score with standard Z-score
• Using same threshold for both methods
• Not understanding the robustness advantage
FAQ
Q: What's the difference between IQR and Z-score outlier detection methods?
A: The IQR method uses quartiles: \( \text{Lower Bound} = Q1 - 1.5 \times \text{IQR} \) and \( \text{Upper Bound} = Q3 + 1.5 \times \text{IQR} \).
The Z-score method uses: \( z = \frac{x - \mu}{\sigma} \) and flags outliers where \( |z| > \text{threshold} \).
Key Differences:
- IQR: Robust, rank-based, works for any distribution
- Z-score: Assumes normal distribution, sensitive to outliers
- IQR: Uses median and quartiles
- Z-score: Uses mean and standard deviation
Choose IQR for skewed data or when outliers are suspected; Z-score for normally distributed data.
Q: How do I decide what threshold to use for outlier detection?
A: Threshold selection depends on your tolerance for false positives and the application:
- Strict Detection: Use lower thresholds (e.g., Z-score 2, IQR 1.0×IQR)
- Standard Detection: Use common thresholds (e.g., Z-score 3, IQR 1.5×IQR)
- Lenient Detection: Use higher thresholds (e.g., Z-score 3.5, IQR 2.2×IQR)
Consider the consequences of removing valid data points vs. keeping actual outliers. Domain knowledge is crucial for threshold selection.