Survey Response Rate Calculator
Optimize survey performance • 2026 edition
Survey Response Rate Formula:
Show the calculator\( \text{Response Rate} = \frac{\text{Completed Responses}}{\text{Invitations Sent}} \times 100\% \)
Where:
- Response Rate = Percentage of people who completed the survey
- Completed Responses = Number of surveys fully completed
- Invitations Sent = Total number of invitations distributed
This formula calculates the percentage of invited participants who completed the survey. For sample size estimation, the Cochran formula is used:
\( n_0 = \frac{Z^2 \times p \times (1-p)}{e^2} \)
Where:
- n₀ = Initial sample size
- Z = Z-score for confidence level
- p = Estimated proportion (0.5 for maximum variance)
- e = Margin of error
Adjusted sample size: \( n = \frac{n_0}{1 + \frac{n_0}{N}} \) where N is population size.
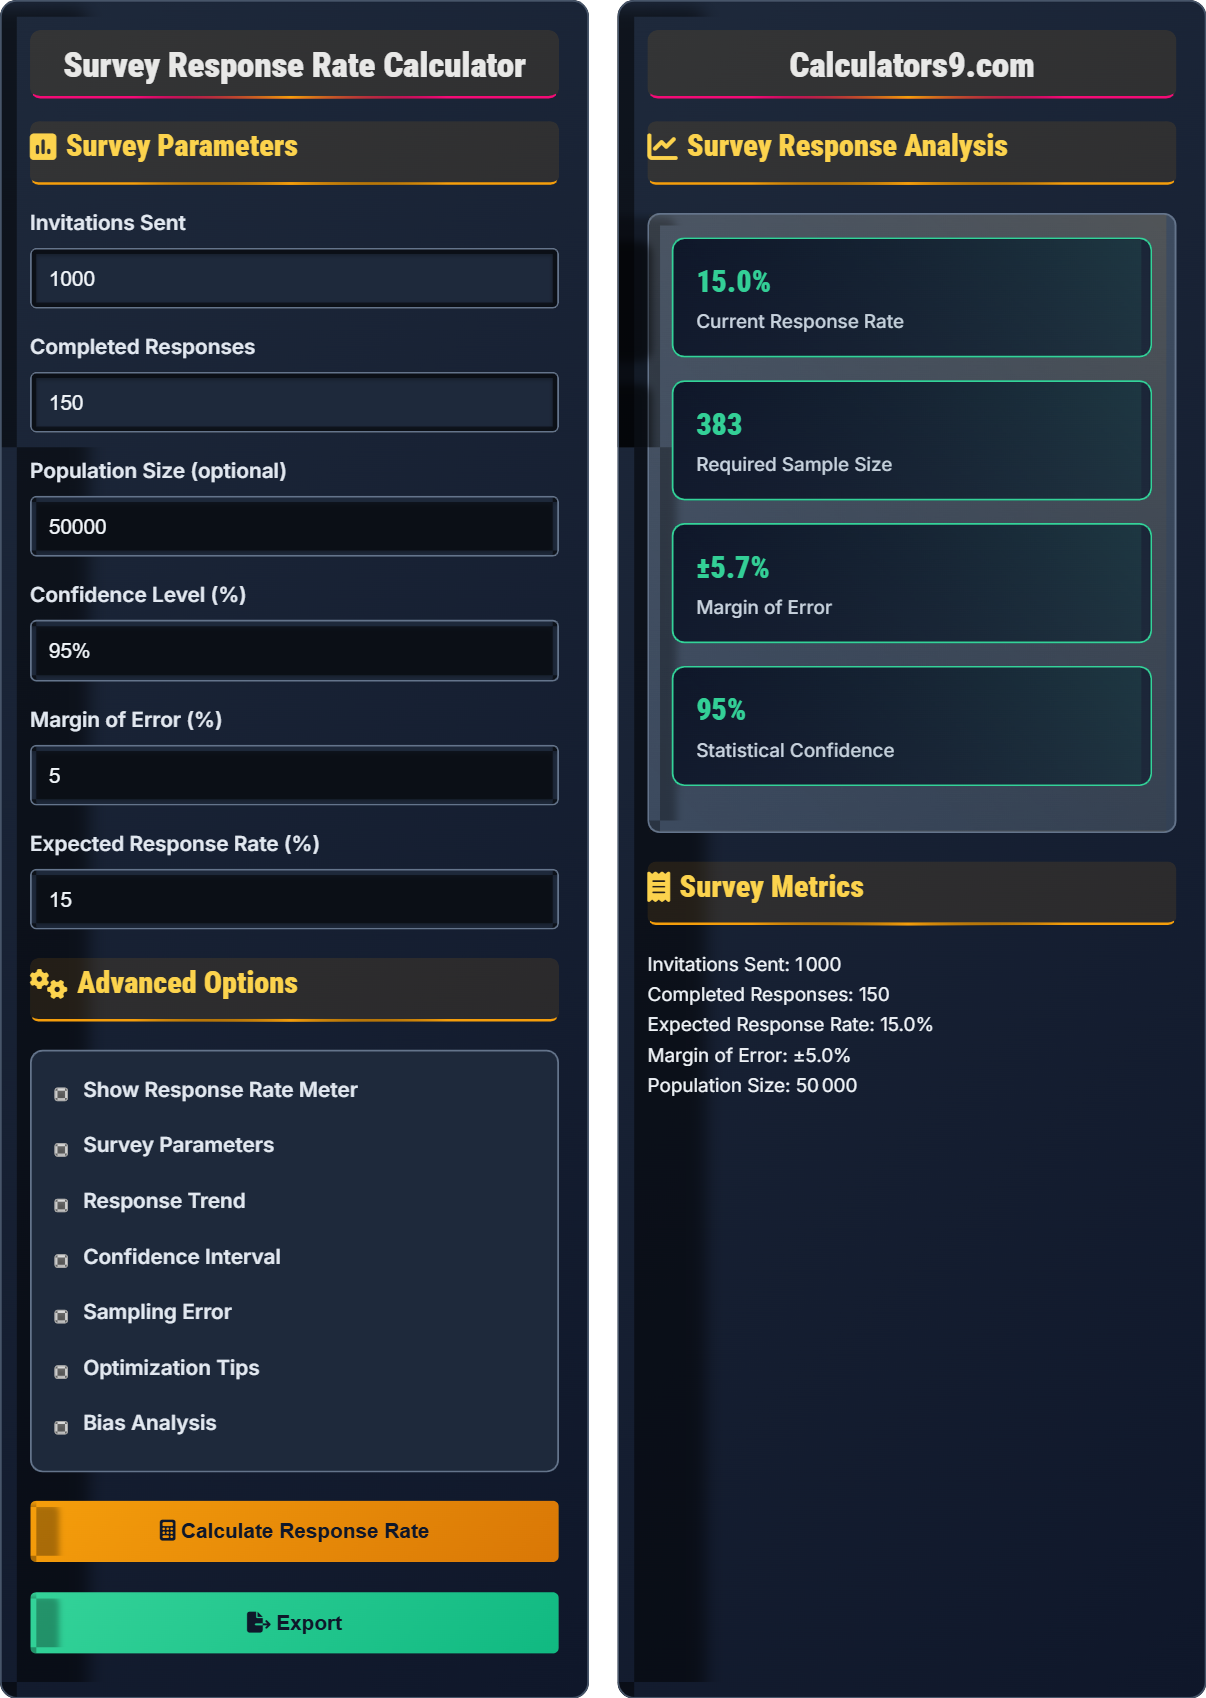
Example: With 1000 invitations sent and 150 completed responses:
\( \text{Response Rate} = \frac{150}{1000} \times 100\% = 15\% \)
For a 95% confidence level and 5% margin of error: \( n_0 = \frac{1.96^2 \times 0.5 \times 0.5}{0.05^2} = 384 \) required respondents.
Survey Parameters
Advanced Options
Survey Response Analysis
Survey Metrics
Survey Methodology Fundamentals
Survey response rate is the percentage of people who completed a survey among those who were invited to participate. It's a key metric for assessing survey quality and validity.
\( n_0 = \frac{Z^2 \times p \times (1-p)}{e^2} \)
Where n₀=initial sample size, Z=Z-score for confidence level, p=estimated proportion, e=margin of error.
- Higher response rates generally indicate better data quality
- 10-15% is typical for online surveys
- Response rates above 30% are considered excellent
- Non-response bias can affect results validity
Optimization Strategies
Multiple factors influence response rates including survey length, incentives, follow-ups, and target audience relevance.
- Keep surveys short and focused
- Offer appropriate incentives
- Send strategic follow-ups
- Personalize communications
- Test different survey lengths
- Optimize for mobile devices
- Provide clear value proposition
- Respect participant time
Survey Response Rate Learning Quiz
What is considered an excellent response rate for online surveys?
The answer is C) 30%+. Response rates above 30% are considered excellent for online surveys. Typical response rates for online surveys range from 10-15%, so 30%+ indicates exceptional performance and data quality.
Survey response rates vary significantly by mode of administration. Online surveys typically have lower response rates than phone or in-person surveys due to factors like email overload and lack of personal contact. Understanding benchmarks helps evaluate survey performance.
Response Rate: Percentage of completed surveys among invitations sent
Data Quality: Reliability and validity of collected data
Non-Response Bias: Systematic differences between respondents and non-respondents
• Higher response rates generally correlate with better data quality
• Different survey modes have different typical response rates
• Context matters when interpreting response rates
• Compare response rates within similar contexts
• Consider response rate alongside other quality metrics
• Track response rates over time to identify trends
• Expecting high response rates for online surveys without optimization
• Not considering survey mode when setting expectations
• Focusing solely on response rate without considering bias
Calculate the required sample size for a survey with 95% confidence level, 5% margin of error, and unknown population proportion. If the target population is 10,000, what is the adjusted sample size?
Step 1: Identify parameters
Confidence level = 95%, so Z = 1.96
Margin of error (e) = 0.05
Unknown proportion (p) = 0.5 (maximum variance)
Step 2: Calculate initial sample size
n₀ = (Z² × p × (1-p)) / e²
n₀ = (1.96² × 0.5 × 0.5) / 0.05²
n₀ = (3.8416 × 0.25) / 0.0025
n₀ = 0.9604 / 0.0025 = 384.16 ≈ 384
Step 3: Calculate adjusted sample size for finite population
n = n₀ / (1 + (n₀/N))
n = 384 / (1 + (384/10,000))
n = 384 / (1 + 0.0384) = 384 / 1.0384 = 370.08 ≈ 370
Therefore, the required sample size is 370.
This calculation shows how to determine the minimum sample size needed for reliable survey results. The finite population correction adjusts for smaller populations, reducing the required sample size. Using p=0.5 provides the most conservative estimate.
Sample Size: Number of participants needed for statistical validity
Finite Population Correction: Adjustment for smaller populations
Conservative Estimate: Using p=0.5 for maximum variance
• Use p=0.5 for unknown proportions to get maximum sample size
• Apply finite population correction for populations under 100,000
• Larger samples provide smaller margins of error
• Use online calculators to verify manual calculations
• Consider response rate when planning invitations
• Plan for potential sample loss during survey
• Forgetting to apply finite population correction
• Using inappropriate Z-scores for confidence levels
• Not accounting for expected non-response rates
A company needs to survey 400 customers with 95% confidence and 5% margin of error. Historical data shows a 12% response rate. How many invitations should they send to achieve the required sample size? What if they implement strategies that increase the response rate to 18%?
Step 1: Calculate required invitations at 12% response rate
Required sample size = 400
Response rate = 12% = 0.12
Invitations needed = Required sample / Response rate
Invitations needed = 400 / 0.12 = 3,333.33 ≈ 3,334
Step 2: Calculate required invitations at 18% response rate
Response rate = 18% = 0.18
Invitations needed = 400 / 0.18 = 2,222.22 ≈ 2,223
Step 3: Calculate efficiency gain
Difference = 3,334 - 2,223 = 1,111 fewer invitations needed
Therefore, they need to send 3,334 invitations at 12% response rate, or 2,223 at 18% response rate.
This example demonstrates the relationship between response rate and required invitations. Higher response rates significantly reduce the number of invitations needed, making surveys more efficient and cost-effective. This shows the value of response rate optimization strategies.
Response Rate Efficiency: Relationship between response rate and invitations needed
Survey Efficiency: Cost-effectiveness of data collection
Sample Requirement: Minimum number of responses needed for validity
• Required invitations = Required sample size / Response rate
• Higher response rates reduce required invitations exponentially
• Plan for response rate variations when designing surveys
• Always plan for higher invitation counts than required responses
• Implement strategies to improve response rates
• Monitor early response patterns to adjust strategy
• Sending invitations equal to required sample size
• Not accounting for historical response rates
• Failing to adjust for seasonal or demographic variations
A survey achieved a 20% response rate with 200 completed responses from 1,000 invitations. The survey found that 65% of respondents prefer product A over product B. How might non-response bias affect this result, and what strategies could mitigate this?
Step 1: Analyze the response rate
Response rate = 200/1,000 = 20% (good response rate)
Step 2: Assess non-response bias risk
With 80% non-response, there's moderate risk of non-response bias if non-respondents differ systematically from respondents regarding product preferences.
Step 3: Potential bias implications
If non-respondents are more likely to prefer product B, the true preference for product A could be lower than 65%.
Step 4: Mitigation strategies
• Follow up with non-respondents using different contact methods
• Compare respondent characteristics to known population demographics
• Weight results to match known population parameters
• Conduct post-stratification analysis
Therefore, while the result shows 65% preference for product A, non-response bias could affect this estimate, and mitigation strategies should be implemented.
Non-response bias occurs when those who don't respond differ systematically from those who do respond. Even with good response rates, if non-respondents have different characteristics, the results may not represent the true population. This demonstrates why response rate alone doesn't guarantee survey validity.
Non-Response Bias: Systematic differences between respondents and non-respondents
Survey Validity: Accuracy of survey results in representing the population
Post-Stratification: Adjusting results after data collection
• Response rate alone doesn't guarantee lack of bias
• Always assess representativeness of respondents
• Implement bias mitigation strategies proactively
• Track early vs late responders for bias assessment
• Use multiple contact methods to reach diverse respondents
• Compare sample demographics to population demographics
• Assuming high response rates eliminate bias
• Not validating sample representativeness
• Failing to implement bias mitigation strategies
Which of the following factors typically has the LEAST impact on survey response rates?
The answer is C) Color scheme of the survey interface. While visual appeal can impact user experience, color scheme typically has the least impact on response rates compared to fundamental factors like survey length, incentives, and follow-up timing. These core factors directly affect participation motivation and completion likelihood.
Survey optimization should focus on factors that directly impact participation decisions. Survey length affects time commitment, incentives provide motivation, and follow-ups increase exposure. While aesthetics matter, they're secondary to these core motivators and barriers to participation.
Response Rate Drivers: Factors that significantly impact participation
Survey Optimization: Improving response rates through design choices
Participation Barriers: Factors that prevent survey completion
• Focus optimization efforts on high-impact factors first
• Survey length and incentives have proven impact on response rates
• Follow-up strategies can significantly improve completion rates
• Test different survey lengths to find optimal balance
• Use appropriate incentives for your target audience
• Time follow-ups strategically (e.g., 3-5 days after initial invitation)
• Over-investing in visual design at expense of core functionality
• Offering incentives that are too small or too large
• Not testing different optimization strategies
FAQ
Q: How do I calculate the required sample size for a survey?
A: The Cochran formula is commonly used: \( n_0 = \frac{Z^2 \times p \times (1-p)}{e^2} \).
Where:
- \( n_0 \) = Initial sample size
- \( Z \) = Z-score for confidence level (1.96 for 95%)
- \( p \) = Estimated proportion (0.5 for maximum variance)
- \( e \) = Margin of error (0.05 for 5%)
For finite populations: \( n = \frac{n_0}{1 + \frac{n_0}{N}} \) where N is population size.
Example: For 95% confidence, 5% margin of error: \( n_0 = \frac{1.96^2 \times 0.5 \times 0.5}{0.05^2} = 384 \) required respondents.
Q: What are effective strategies to improve survey response rates?
A: Research shows the most effective strategies include:
- Keep surveys short: 5-10 questions maximum
- Offer incentives: Small rewards (5-10%) can significantly boost response
- Send follow-ups: 2-3 reminders at strategic intervals
- Personalize communications: Use recipient names and relevant context
- Optimize for mobile: Ensure compatibility with smartphones
Combining multiple strategies typically yields the best results.