Cart Abandonment Calculator
Recovery & optimization analysis • 2026 e-commerce
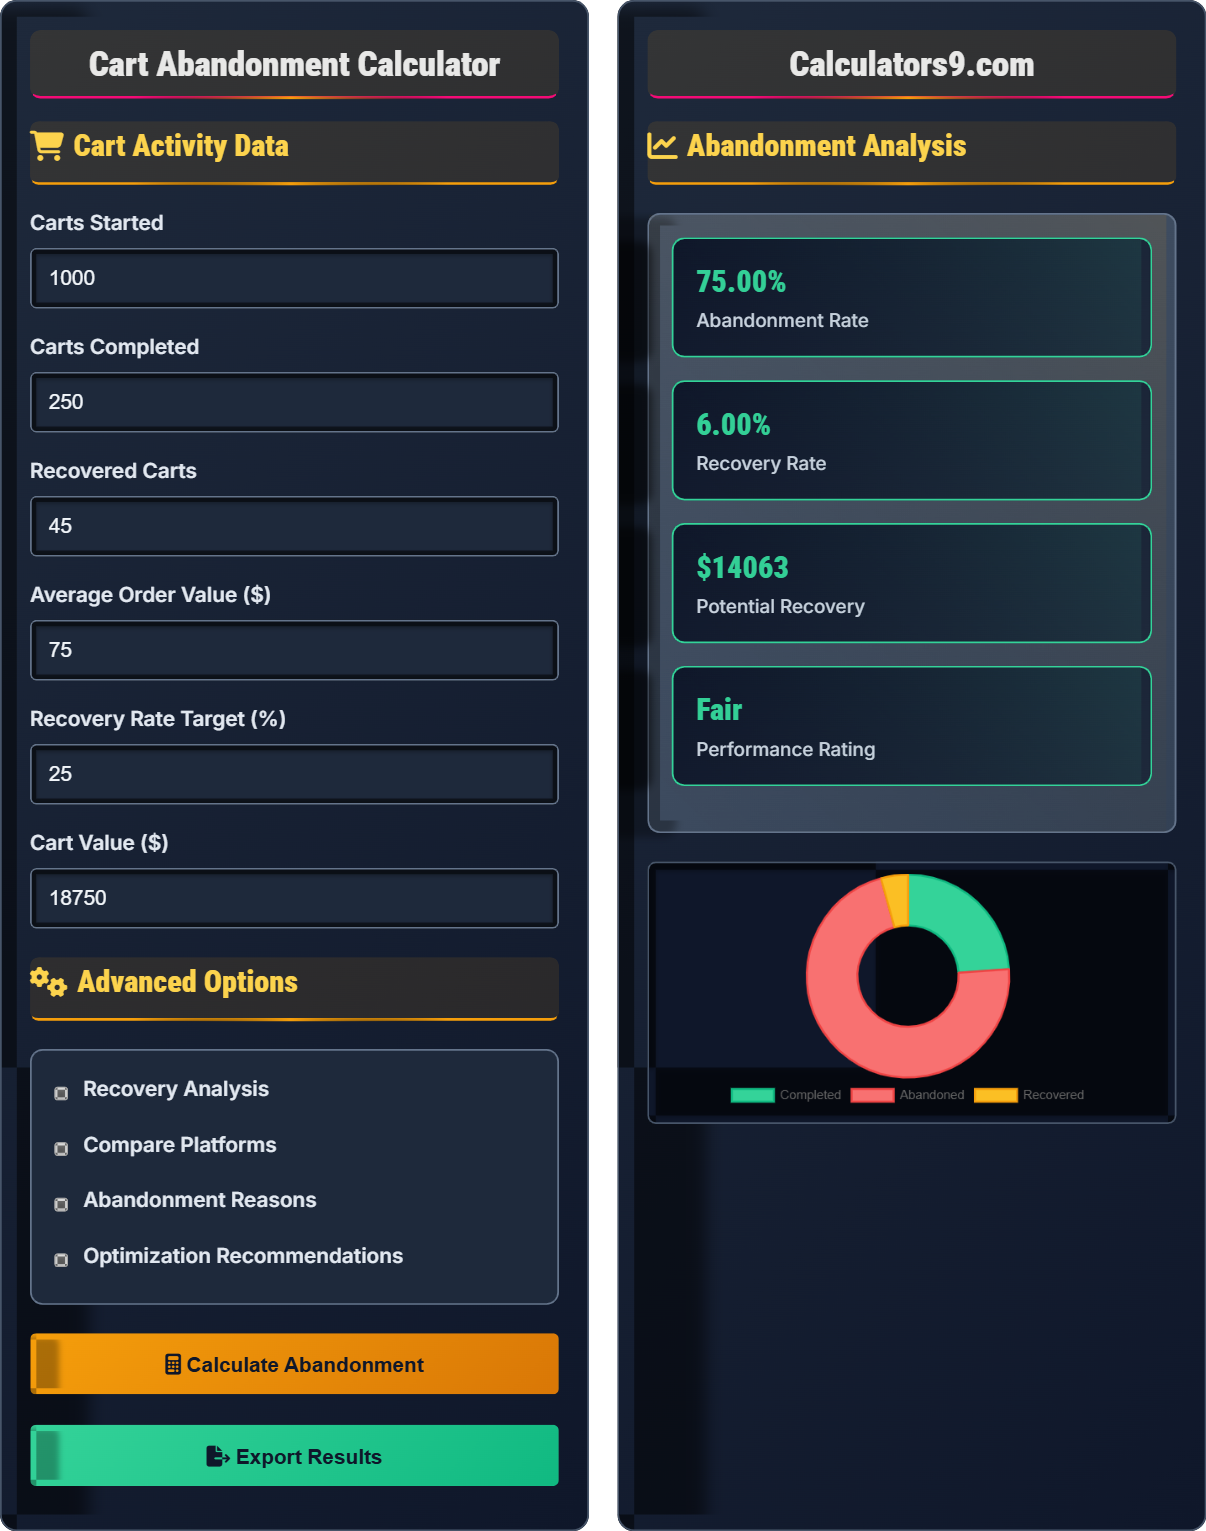
Cart Activity Data
Advanced Options
Abandonment Analysis
| Metric | Value | Industry Average | Rating |
|---|
| Scenario | Abandonment | Recovery | Potential Gain |
|---|
Comprehensive Cart Abandonment Guide
Cart abandonment occurs when a visitor adds items to their shopping cart but leaves the website before completing the purchase. The abandonment rate is a critical e-commerce metric that measures the percentage of incomplete transactions. Globally, cart abandonment costs retailers over $2.6 billion annually.
The standard cart abandonment calculation uses this formula:
Where:
- \(Carts\ Started\) = Total sessions where items were added to cart
- \(Carts\ Completed\) = Total sessions where purchase was completed
- \(Abandonment\ Rate\) = Percentage of carts not converted to sales
According to Baymard Institute research, the main reasons for cart abandonment:
- Unexpected Costs: 55% - Shipping costs, taxes, fees appearing at checkout
- Account Creation: 24% - Forced registration before checkout
- Complex Checkout: 18% - Too many steps or fields
- Security Concerns: 17% - Untrusted payment security
- Slow Delivery: 16% - Longer than expected shipping times
- Payment Options: 15% - Limited payment methods
Addressing these issues can improve conversion rates by 20-35%.
- Email Reminders: Automated sequences with incentives
- SMS Notifications: Higher open rates for quick reminders
- Exit-Intent Popups: Capture visitors before leaving
- Progressive Checkout: Streamlined, minimal steps
- Guest Checkout: Remove mandatory account creation
- Trust Signals: Security badges, reviews, guarantees
Cart Abandonment Learning Quiz
What does a cart abandonment rate of 75% mean?
The answer is C) Both A and B. A 75% abandonment rate means that 75% of customers who start a cart do not complete their purchase, while the remaining 25% do complete the purchase. The abandonment rate and completion rate must add up to 100%.
Cart abandonment rate is calculated as (Abandoned Carts / Total Carts Started) × 100. If 75% of carts are abandoned, then 25% must be completed. This inverse relationship is fundamental to understanding conversion metrics. Understanding this helps businesses set realistic improvement targets.
Cart Abandonment: Adding items to cart but not completing purchase
Conversion Rate: Percentage of visitors who complete purchase
Abandonment Rate: Percentage of carts not converted to sales
• Abandonment Rate + Conversion Rate = 100%
• Track from cart start to completion
• Compare to industry benchmarks
• Remember: Abandoned + Completed = Started
• Focus on improving the conversion rate
• Set realistic improvement targets
• Confusing abandonment rate with conversion rate
• Not tracking cart starts accurately
• Comparing to wrong industry benchmarks
Calculate the abandonment rate for a store that had 800 carts started and 200 carts completed. Show your work.
Step 1: Calculate abandoned carts
Abandoned Carts = Total Carts Started - Carts Completed
Abandoned Carts = 800 - 200 = 600
Step 2: Calculate abandonment rate
Abandonment Rate = (Abandoned Carts / Total Carts Started) × 100
Abandonment Rate = (600 / 800) × 100 = 0.75 × 100 = 75%
The abandonment rate is 75%.
This calculation demonstrates the fundamental abandonment rate formula. With 800 total carts started and only 200 completed, 600 were abandoned, resulting in a 75% abandonment rate. This is higher than the industry average of 70-80%, indicating significant opportunity for improvement.
Cart Started: Session where items added to cart
Cart Completed: Session where purchase finalized
Abandoned Cart: Started but not completed
• Abandonment Rate = (Abandoned / Started) × 100
• Always verify your calculation
• Compare to industry benchmarks
• Remember: (Started - Completed) = Abandoned
• Check if result makes business sense
• Track trends over time
• Forgetting to multiply by 100 for percentage
• Using wrong values in numerator/denominator
• Not accounting for recovered carts
A store has 1,200 carts started with 300 completed, average order value of $60. If they recover 20% of abandoned carts, how much additional revenue could they generate? What is their current abandonment rate?
Step 1: Calculate abandonment rate
Abandoned Carts = 1,200 - 300 = 900
Abandonment Rate = (900 / 1,200) × 100 = 75%
Step 2: Calculate recoverable carts
Recoverable Carts = 900 × 0.20 = 180
Step 3: Calculate potential revenue
Potential Revenue = 180 × $60 = $10,800
The current abandonment rate is 75%, and they could generate $10,800 in additional revenue.
This example shows the financial impact of cart abandonment recovery. With 75% abandonment rate, the store is losing significant revenue. Recovering just 20% of abandoned carts could generate over $10,000 in additional revenue. This demonstrates the importance of implementing recovery strategies.
Recovery Rate: Percentage of abandoned carts converted
Recovery Potential: Revenue from recovered cartsFinancial Impact: Monetary value of improvements
• Calculate abandonment rate first
• Apply recovery rate to abandoned carts
• Multiply by average order value
• Quantify the financial impact of improvements
• Set realistic recovery targets
• Calculate ROI of recovery efforts
• Not calculating abandonment rate first
• Applying recovery rate to total carts instead of abandoned
• Forgetting to multiply by average order value
A store currently has an 80% abandonment rate and processes 2,000 carts monthly. If they reduce abandonment to 65%, what will be the improvement in conversions? How much additional revenue could they generate with $85 average order value?
Step 1: Calculate current conversions
Current Abandoned = 2,000 × 0.80 = 1,600
Current Completed = 2,000 - 1,600 = 400
Step 2: Calculate improved conversions
Improved Abandoned = 2,000 × 0.65 = 1,300
Improved Completed = 2,000 - 1,300 = 700
Step 3: Calculate improvement
Additional Conversions = 700 - 400 = 300
Additional Revenue = 300 × $85 = $25,500
They would improve by 300 additional conversions, generating $25,500 more revenue.
This demonstrates the significant financial impact of reducing abandonment rates. A 15 percentage point reduction (from 80% to 65%) results in 300 additional completed orders and over $25,000 in additional revenue. This shows why even small improvements in abandonment rates can have substantial business impact.
Abandonment Reduction: Decreasing the percentage of abandoned carts
Conversion Improvement: Increase in completed purchases
Revenue Impact: Financial benefit of improvements
• Calculate both before and after scenarios
• Focus on absolute number of conversions
• Quantify financial impact
• Calculate both rate and absolute improvements
• Quantify benefits to justify investments
• Set measurable targets
• Only focusing on rate improvements without absolute numbers
• Not quantifying financial benefits
• Setting unrealistic improvement targets
Which factor causes the highest cart abandonment rate?
The answer is B) Unexpected shipping costs. According to Baymard Institute research, unexpected costs (shipping, taxes, fees) are the #1 cause of cart abandonment at 55%. This is followed by account creation requirements (24%) and complicated checkout processes (18%).
Understanding the primary causes of abandonment helps prioritize optimization efforts. Shipping costs appearing late in checkout is the biggest deterrent. Transparent pricing from the start, offering free shipping thresholds, or displaying shipping costs early can significantly reduce abandonment rates.
Primary Cause: Factor causing most abandonment
Unexpected Costs: Fees appearing at checkout
Transparency: Clear pricing from start
• Address primary causes first
• Be transparent about all costs
• Eliminate friction in checkout
• Display shipping costs early in process
• Offer free shipping thresholds
• Clearly communicate all fees upfront
• Adding shipping costs at last step
• Hiding additional fees until checkout
• Not addressing primary abandonment causes
Abandonment Fundamentals
Abandonment rate, recovery rate, cart value, and conversion metrics.
\(Abandonment\ Rate = \frac{Started - Completed}{Started} \times 100\)
\(Recovery\ Rate = \frac{Recovered}{Abandoned} \times 100\)
\(Potential\ Revenue = Abandoned \times AOV\)
- Track from cart start to completion
- Address primary abandonment causes first
- Measure both rate and absolute improvements
Optimization Strategies
Recovery campaigns, checkout optimization, trust signals, and friction reduction.
- Display shipping costs early
- Offer guest checkout
- Streamline checkout process
- Implement recovery email sequences
- Mobile optimization is critical
- Security and trust matter
- Test changes incrementally
- Monitor recovery ROI
FAQ
Q: What's a good cart abandonment rate?
A: Below 60% is excellent, 60-70% is good. Industry average is 70-80%. Mobile typically has 85-90%. Focus on reducing from your current rate rather than absolute targets.
Q: How can I recover abandoned carts?
A: Email/SMS recovery sequences, exit-intent popups, retargeting ads, simplified checkout, guest checkout, trust signals. Recovery rates of 10-30% are achievable with proper strategies.