Email Open Rate Calculator
Engagement & performance analysis • 2026 e-commerce
Email Campaign Data
Advanced Options
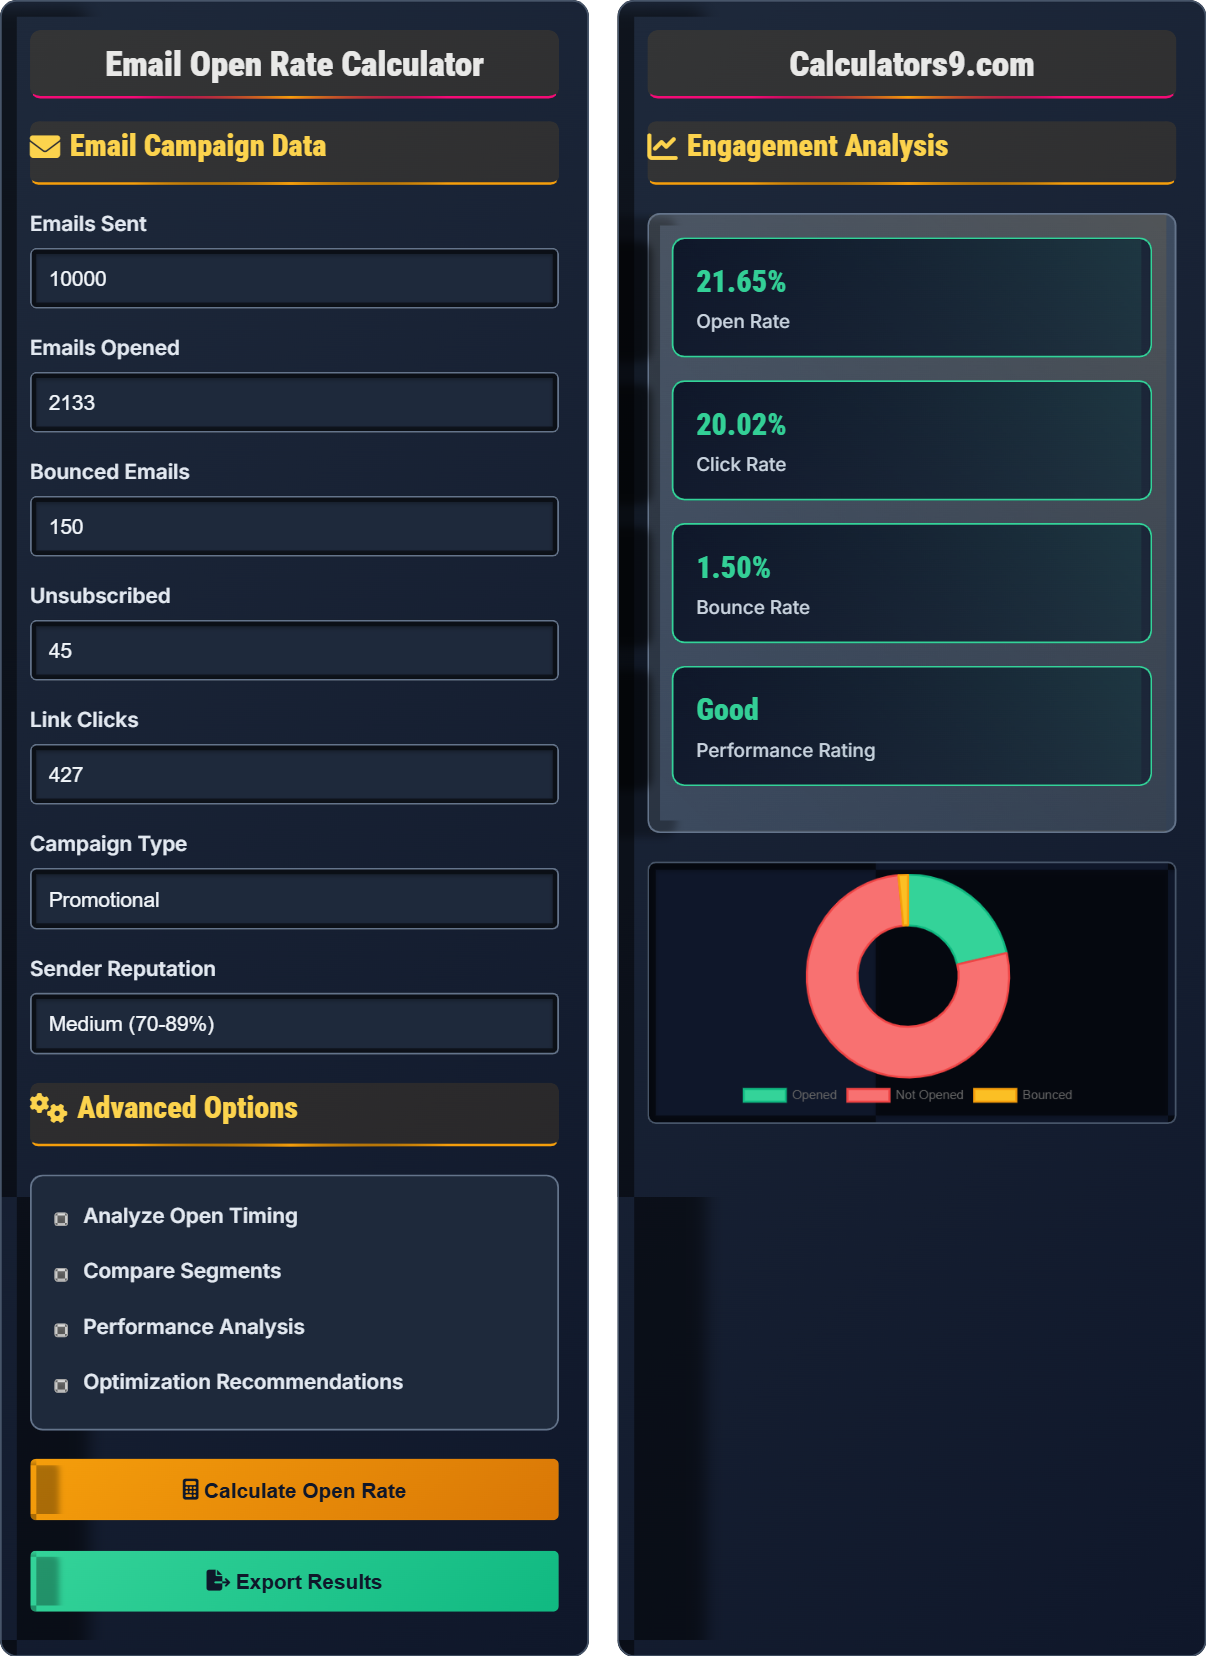
Engagement Analysis
| Metric | Value | Industry Average | Rating |
|---|
| Scenario | Open Rate | Click Rate | Improvement |
|---|
Comprehensive Email Engagement Guide
Email open rate is the percentage of recipients who open an email in a campaign. It's a fundamental metric for email marketing success, indicating how well your subject lines and sender reputation capture attention. Open rates vary significantly by industry, audience segment, and email type. For e-commerce, open rates typically range from 18-22%.
The standard open rate calculation uses this formula:
Where:
- \(Emails\ Opened\) = Unique emails opened
- \(Emails\ Sent\) = Total emails sent
- \(Bounces\) = Hard and soft bounces
Multiple variables impact email open rates:
- Subject Lines: 35% of emails are opened based on subject line alone
- Sender Name: Recognizable senders see 33% higher open rates
- Send Time: Tuesday-Thursday, 10am-2pm optimal for most audiences
- List Hygiene: Clean lists perform 14% better than dirty lists
- Mobile Optimization: 46% of emails opened on mobile devices
- Personalization: Personalized subject lines boost opens by 26%
Top-performing e-commerce brands achieve 30%+ open rates through strategic optimization.
- A/B Testing: Test subject lines, send times, and personalization
- Segmentation: Send targeted content based on behavior and preferences
- Preview Text: Optimize the preheader text that appears after subject line
- Frequency Management: Avoid overwhelming subscribers with too many emails
- Mobile-First Design: Ensure emails render properly on all devices
Email Engagement Learning Quiz
How is email open rate calculated?
The answer is D) Both B and C. Email open rate is calculated as Opened emails ÷ (Sent - Bounces) or equivalently Opened emails ÷ Delivered emails. Bounces (both hard and soft) are excluded from the denominator because they never reached the recipient's inbox.
Open rate calculation is critical for accurate performance measurement. Including bounced emails in the denominator would artificially deflate the open rate, making campaigns appear less successful than they actually are. The delivered emails figure already excludes bounces, so both formulations yield the same result.
Open Rate: Percentage of delivered emails that were opened
Hard Bounce: Permanent delivery failure (invalid email)
Soft Bounce: Temporary delivery failure (full mailbox)
• Exclude bounces from the denominator
• Only count unique opens
• Ensure email tracking is enabled
• Remember: (Opened ÷ Delivered) × 100
• Clean your list regularly to reduce bounces
• Track open rates separately for different segments
• Including bounces in the denominator
• Counting multiple opens by same recipient
• Not accounting for image blocking
Calculate the open rate for an email campaign that sent 5,000 emails, had 150 bounces, and 850 opens. Show your work.
Step 1: Calculate delivered emails
Delivered = Sent - Bounces
Delivered = 5,000 - 150 = 4,850
Step 2: Calculate open rate
Open Rate = (Opened ÷ Delivered) × 100
Open Rate = (850 ÷ 4,850) × 100 = 0.1753 × 100 = 17.53%
The open rate is 17.53%.
This calculation demonstrates the proper method for determining open rate. With 150 bounces, only 4,850 emails were successfully delivered. Of those, 850 were opened, resulting in a 17.53% open rate. This is slightly below the e-commerce industry average of 18-22%.
Delivered Emails: Emails that reached recipient's server
Unique Opens: First open by each recipient
Industry Average: Benchmark for comparison
• Open Rate = (Opened ÷ Delivered) × 100
• Always exclude bounces from denominator
• Compare to relevant industry benchmarks
• Remember: Delivered = Sent - Bounces
• Track open rates by campaign type
• Monitor bounce rates for list health
• Forgetting to subtract bounces from denominator
• Not accounting for image blocking
• Using total opens instead of unique opens
Campaign A sent 8,000 emails (200 bounces, 1,400 opens). Campaign B sent 12,000 emails (300 bounces, 2,100 opens). Which performed better relative to industry average of 21.33%? Calculate the difference.
Step 1: Calculate Campaign A open rate
Delivered A = 8,000 - 200 = 7,800
Open Rate A = (1,400 ÷ 7,800) × 100 = 17.95%
Step 2: Calculate Campaign B open rate
Delivered B = 12,000 - 300 = 11,700
Open Rate B = (2,100 ÷ 11,700) × 100 = 17.95%
Step 3: Compare to industry average
Both campaigns achieved 17.95% open rate
Difference from industry average = 21.33% - 17.95% = 3.38%
Both campaigns performed equally, 3.38% below industry average.
This example shows how to compare campaigns of different sizes using open rate percentages. Despite different absolute numbers (Campaign B had more opens), both campaigns achieved identical performance when normalized by delivered emails. Both underperformed the industry average, suggesting optimization opportunities.
Normalized Performance: Metrics adjusted for scale differences
Industry Benchmark: Standard for comparison
Relative Performance: Performance vs. benchmarks
• Calculate open rate using delivered emails
• Compare campaigns using percentages
• Always benchmark against industry standards
• Use percentages for fair comparison
• Segment by campaign type for accurate benchmarks
• Monitor trends over time
• Comparing absolute numbers instead of percentages
• Not accounting for bounces in comparison
• Using wrong industry benchmarks
A company has 50,000 subscribers with 20% open rate. If they improve to 25% through optimization, how many additional opens will they get? What is the percentage improvement?
Step 1: Calculate current opens
Assuming 48,000 delivered emails (after 2,000 bounces)
Current opens = 48,000 × 0.20 = 9,600 opens
Step 2: Calculate improved opens
Improved opens = 48,000 × 0.25 = 12,000 opens
Step 3: Calculate additional opens
Additional opens = 12,000 - 9,600 = 2,400 opens
Step 4: Calculate percentage improvement
Improvement = (25 - 20) ÷ 20 × 100 = 25%
They will get 2,400 additional opens, a 25% improvement.
This demonstrates the significant impact of improving open rates. A 5 percentage point increase (20% to 25%) represents a 25% relative improvement. At scale (50,000 subscribers), this translates to 2,400 additional opens, which can significantly impact click-through rates, conversions, and revenue.
Percentage Improvement: Relative change from baseline
Absolute Improvement: Point difference in percentages
Scale Impact: Effect of improvements at large volumes• Percentage improvement = (New - Old) ÷ Old × 100
• Absolute improvement = New - Old
• Small percentage changes have large impacts at scale
• Calculate both absolute and relative improvements
• Consider scale when evaluating optimization ROI
• Set realistic improvement targets
• Confusing percentage points with percentage improvement
• Not considering scale in impact calculations
• Setting unrealistic improvement targets
Which factor has the greatest impact on email open rates?
The answer is B) Subject line and sender name. Studies show that 35% of emails are opened based solely on the subject line, and recognizable sender names significantly impact open rates. While all factors matter, the subject line and sender name are the first things recipients see and determine whether they engage with the email.
Subject lines and sender names are critical because they're the first interaction points. A compelling subject line creates curiosity or urgency, while a trusted sender name builds recognition. These elements determine whether the email gets opened, making them foundational to all other engagement metrics.
First Interaction: Initial contact with recipient
Engagement Funnel: Open → Click → Convert sequence
Recognition Factor: Impact of familiar sender
• Subject lines determine open rates
• Sender reputation affects deliverability
• Optimize foundational elements first
• A/B test subject lines regularly
• Use recognizable sender names
• Personalize when possible
• Neglecting subject line optimization
• Using unfamiliar sender names
• Not testing different approaches
Engagement Fundamentals
Open rate, click rate, bounce rate, unsubscribe rate, and conversion rate.
\(Open\ Rate = \frac{Opened}{Delivered} \times 100\)
\(Click\ Rate = \frac{Clicked}{Opened} \times 100\)
\(Bounce\ Rate = \frac{Bounced}{Sent} \times 100\)
- Exclude bounces from denominator
- Track unique opens only
- Compare to relevant benchmarks
Optimization Strategies
Subject line optimization, segmentation, send time testing, list hygiene, and personalization.
- A/B test subject lines regularly
- Segment by engagement level
- Optimize for mobile devices
- Maintain clean email lists
- Industry-specific benchmarks
- Audience preferences
- Compliance requirements
- Platform limitations
FAQ
Q: What's a good email open rate?
A: Industry average is 21.33%. For e-commerce: 18-22%. Above 25% is good, above 30% is excellent. Welcome series: 50%+, Abandoned cart: 45%+. Focus on improvement over time.
Q: How can I improve my open rates?
A: Optimize subject lines, use recognizable sender names, segment your list, send at optimal times (Tue-Thu 10am-2pm), personalize content, maintain list hygiene, and test regularly.