Inventory Turnover Calculator
Stock & performance analysis • 2026 e-commerce
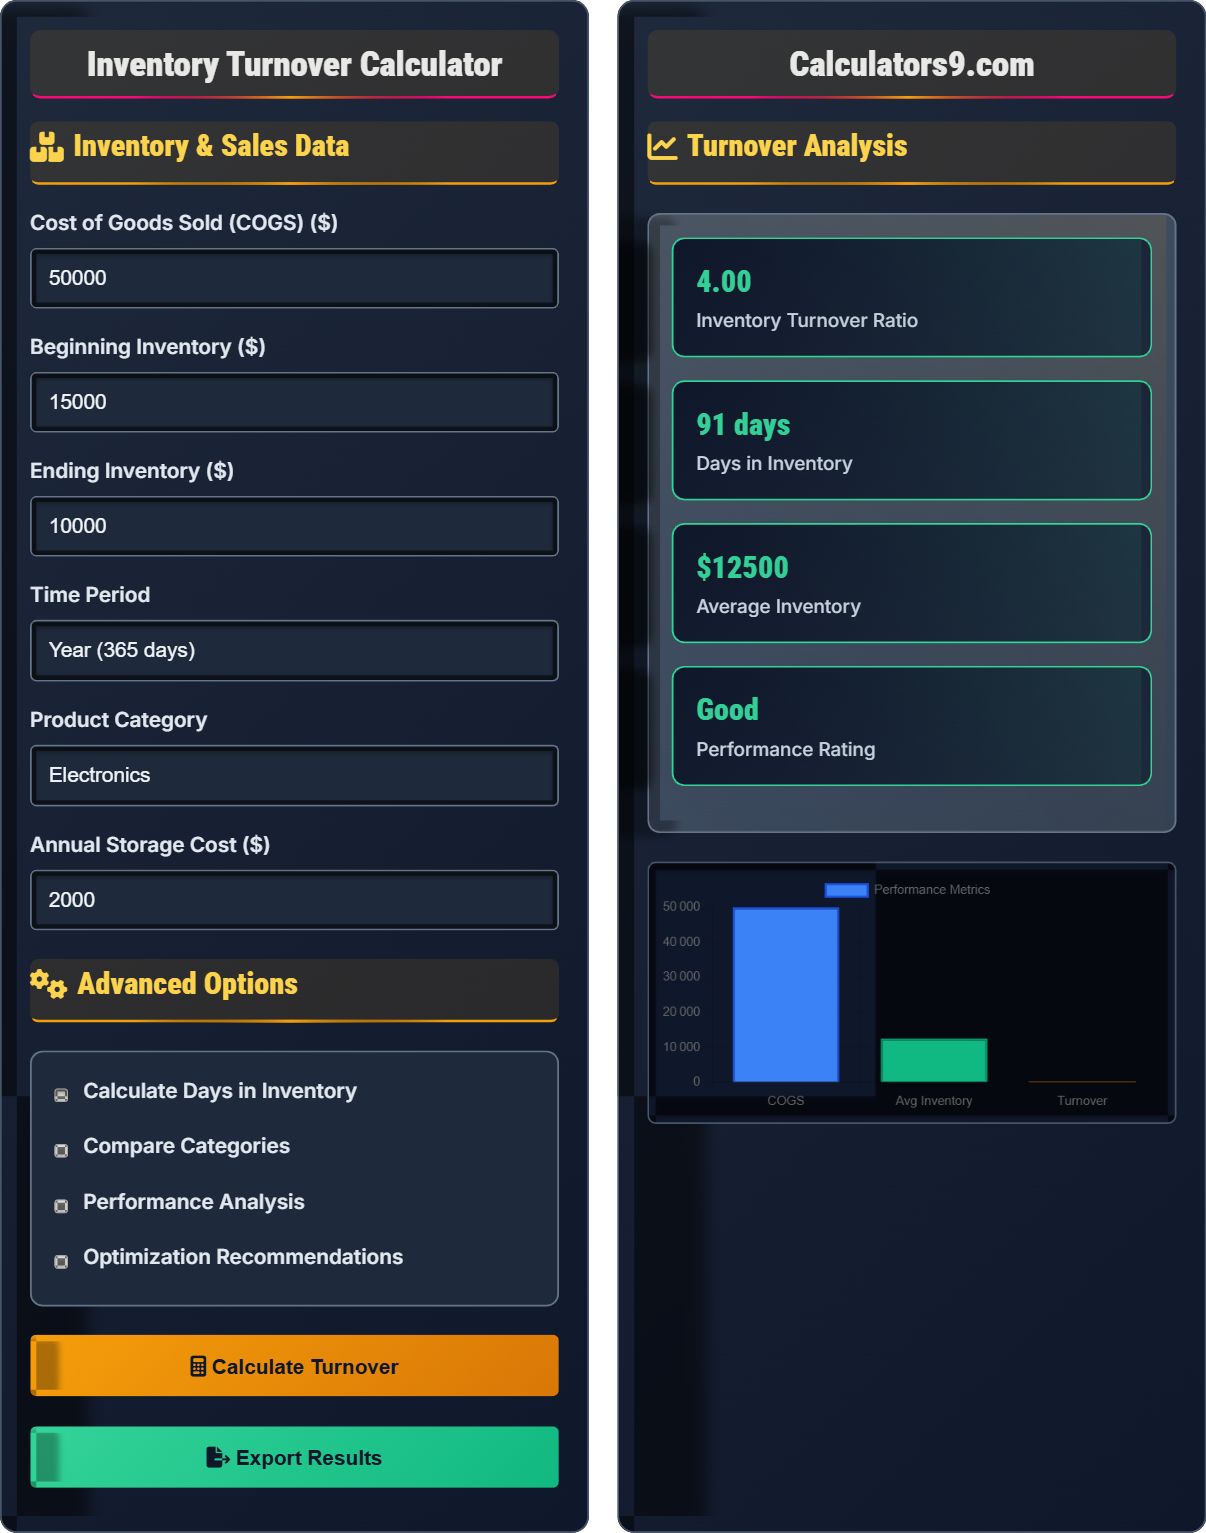
Inventory & Sales Data
Advanced Options
Turnover Analysis
| Metric | Value | Industry Average | Rating |
|---|
| Scenario | Turnover | Days | Recommendation |
|---|
Comprehensive Inventory Turnover Guide
Inventory turnover measures how many times a company sells and replaces its inventory over a specific period. It's a critical metric for e-commerce businesses, indicating how efficiently inventory is managed. Higher turnover generally indicates better inventory management and cash flow.
The standard inventory turnover calculation uses this formula:
Where:
- \(Turnover\) = Number of times inventory is sold/replaced
- \(Cost\ of\ Goods\ Sold\) = Total cost of inventory sold during period
- \(Average\ Inventory\) = (Beginning Inventory + Ending Inventory) ÷ 2
Understanding turnover ratios:
- Below 2x: Very slow, potential overstocking issues
- 2-4x: Slow to moderate, may need optimization
- 4-6x: Good for most e-commerce categories
- 6-8x: Fast turnover, efficient management
- 8+x: Very fast, excellent performance
- Too high: Risk of stockouts and lost sales
Most successful e-commerce businesses aim for 4-6x turnover annually.
- Forecasting: Use historical data and trends for accurate predictions
- ABC Analysis: Prioritize high-turnover items
- Seasonal Planning: Adjust inventory for peak seasons
- Supplier Relationships: Negotiate faster reorder times
- Pricing Strategy: Dynamic pricing to move slow inventory
Inventory Turnover Learning Quiz
What does an inventory turnover ratio of 5 mean?
The answer is A) Inventory is completely sold and replaced 5 times per year. An inventory turnover ratio of 5 means that over the course of a year, the company has sold and restocked its entire inventory 5 times. This indicates efficient inventory management and good cash flow.
The inventory turnover ratio is a measure of how quickly inventory is sold and replaced. A ratio of 5 indicates that the average inventory level is sold and replenished 5 times during the measurement period. This reflects the efficiency of inventory management and the liquidity of inventory assets.
Inventory Turnover: Times inventory is sold/replaced per period
COGS: Cost of Goods Sold - total inventory cost sold
Average Inventory: (Beginning + Ending) ÷ 2
• Higher turnover indicates better inventory management
• Turnover = COGS ÷ Average Inventory
• Consider industry benchmarks for interpretation
• Remember: Times per period, not days
• Compare to industry averages for context
• Balance turnover with stockout risk
• Confusing turnover ratio with days to sell
• Not considering industry-specific benchmarks
• Interpreting higher as always better
Calculate the inventory turnover ratio for a company with COGS of $120,000, beginning inventory of $30,000, and ending inventory of $20,000. Show your work.
Step 1: Calculate average inventory
Average Inventory = (Beginning Inventory + Ending Inventory) ÷ 2
Average Inventory = ($30,000 + $20,000) ÷ 2 = $50,000 ÷ 2 = $25,000
Step 2: Calculate inventory turnover ratio
Turnover = COGS ÷ Average Inventory
Turnover = $120,000 ÷ $25,000 = 4.8
The inventory turnover ratio is 4.8 times per year.
This calculation demonstrates the fundamental inventory turnover formula. The average inventory represents the typical inventory level during the period, smoothing out fluctuations between beginning and ending values. The resulting ratio of 4.8 indicates the company sold and replaced its average inventory 4.8 times during the year.
COGS: Cost of Goods Sold - direct costs of inventory sold
Average Inventory: Mid-point between beginning and ending inventory
Turnover Ratio: Efficiency measure of inventory management
• Always calculate average inventory first
• Use COGS, not sales revenue
• Express as times per period
• Average Inventory = (Beginning + Ending) ÷ 2
• Turnover = COGS ÷ Average Inventory
• Check if result makes business sense
• Using sales revenue instead of COGS
• Forgetting to calculate average inventory
• Using only beginning or ending inventory
A retailer has an inventory turnover ratio of 6. How many days, on average, does inventory stay in the warehouse? If the industry average is 45 days, is this performance good or poor?
Step 1: Calculate days in inventory
Days in Inventory = 365 ÷ Inventory Turnover
Days in Inventory = 365 ÷ 6 = 60.8 days
Step 2: Compare to industry average
Company's days: 60.8 days
Industry average: 45 days
Step 3: Assess performance
Since 60.8 days > 45 days, inventory is turning slower than the industry average. This indicates room for improvement in inventory management.
The inventory stays 60.8 days on average, which is slower than the industry average.
The days in inventory metric converts the turnover ratio into a more intuitive time-based measure. Lower days in inventory generally indicate better performance. In this case, the company's 60.8 days exceeds the industry average of 45 days, suggesting inventory is moving slower than competitors, potentially indicating overstocking or slow-moving items.
Days in Inventory: Average time inventory remains unsold
Inventory Efficiency: How quickly inventory converts to sales
Industry Benchmark: Standard for comparison
• Days in Inventory = 365 ÷ Turnover Ratio
• Lower days indicate better performance
• Compare to industry averages for context
• Days in Inventory = 365 ÷ Turnover
• Lower is generally better
• Consider seasonal variations
• Using 360 instead of 365 days
• Confusing higher with better performance
• Not comparing to industry benchmarks
A company currently has a turnover ratio of 3.0 (122 days in inventory). If they improve inventory management to achieve a turnover of 5.0, what will be the new days in inventory? What percentage improvement is this?
Step 1: Calculate new days in inventory
New Days in Inventory = 365 ÷ New Turnover
New Days in Inventory = 365 ÷ 5.0 = 73 days
Step 2: Calculate improvement
Old Days: 122 days
New Days: 73 days
Reduction: 122 - 73 = 49 days
Step 3: Calculate percentage improvement
Improvement = (Reduction ÷ Old Days) × 100
Improvement = (49 ÷ 122) × 100 = 40.2%
The new days in inventory will be 73 days, representing a 40.2% improvement.
This example demonstrates the significant impact of improving inventory turnover. Moving from 3.0 to 5.0 turnover represents a 67% increase in turnover rate, but results in a 40% reduction in days inventory sits in the warehouse. This improvement can free up substantial cash tied up in inventory and reduce storage costs.
Inventory Optimization: Improving turnover efficiency
Cash Conversion: Reducing inventory holding time
Performance Improvement: Measurable gains in metrics
• Days in Inventory = 365 ÷ Turnover Ratio
• Percentage improvement = (Reduction ÷ Original) × 100
• Small changes in turnover can have large impacts
• Calculate both turnover and days for complete view
• Set realistic improvement targets
• Consider implementation costs vs. benefits
• Calculating improvement on wrong base
• Not considering practical constraints
• Setting unrealistic targets
Which product category typically has the highest inventory turnover ratio?
The answer is B) Electronics. Electronics typically have the highest turnover ratios (6-10x annually) due to short product lifecycles, rapid innovation, and frequent consumer upgrades. Furniture and home decor are typically slow-moving categories with lower turnover ratios (2-4x).
Product category significantly impacts expected turnover ratios. Electronics have high turnover due to technological advancement and consumer desire for latest models. Understanding category-specific benchmarks is crucial for accurate performance assessment. What's excellent for furniture would be poor for electronics.
Category Benchmark: Expected turnover for product type
Product Lifecycle: Time from launch to obsolescence
Consumer Behavior: Purchase patterns by category
• Compare turnover ratios within same category
• Consider product lifecycle in analysis
• Account for seasonal variations
• Research category-specific benchmarks
• Adjust strategies by product category
• Track trends in category performance
• Comparing different product categories directly
• Not considering seasonal factors
• Using generic benchmarks for specific categories
Turnover Fundamentals
COGS, average inventory, turnover ratio, days in inventory, and performance ratings.
\(Turnover = \frac{COGS}{Average\ Inventory}\)
\(Days\ in\ Inventory = \frac{365}{Turnover}\)
\(Average\ Inventory = \frac{Beginning + Ending}{2}\)
- Use COGS, not sales revenue
- Calculate average inventory properly
- Compare to industry benchmarks
Optimization Strategies
Forecasting, ABC analysis, seasonal planning, supplier relationships, and dynamic pricing.
- Use historical data for forecasting
- Implement ABC inventory classification
- Plan for seasonal demand variations
- Negotiate faster supplier lead times
- Balance turnover with service levels
- Consider carrying costs
- Factor in stockout costs
- Monitor category-specific benchmarks
FAQ
Q: What's a good inventory turnover ratio?
A: For e-commerce, 4-6x annually is good. Electronics: 6-10x, Fashion: 4-8x, Books: 3-6x. Too high risks stockouts, too low indicates overstocking.
Q: How can I improve my turnover ratio?
A: Better forecasting, ABC analysis, seasonal planning, faster reorder cycles, dynamic pricing, and supplier relationship management. Focus on high-turnover SKUs.