Percentage to Letter Grade Converter
Convert scores to letters • Academic grading
Grade Conversion Formula:
Show the calculator\( LG = f(P) \)
Where:
- \( LG \) = Letter Grade
- \( P \) = Percentage Score
- \( f \) = Grade Scale Function
This formula maps a percentage score to its corresponding letter grade based on the defined grade scale.
Standard Scale Example:
- A+: 97-100% → A+
- A: 93-96% → A
- A-: 90-92% → A-
- B+: 87-89% → B+
- B: 83-86% → B
- B-: 80-82% → B-
- C+: 77-79% → C+
- C: 73-76% → C
- C-: 70-72% → C-
- D+: 67-69% → D+
- D: 65-66% → D
- F: 0-64% → F
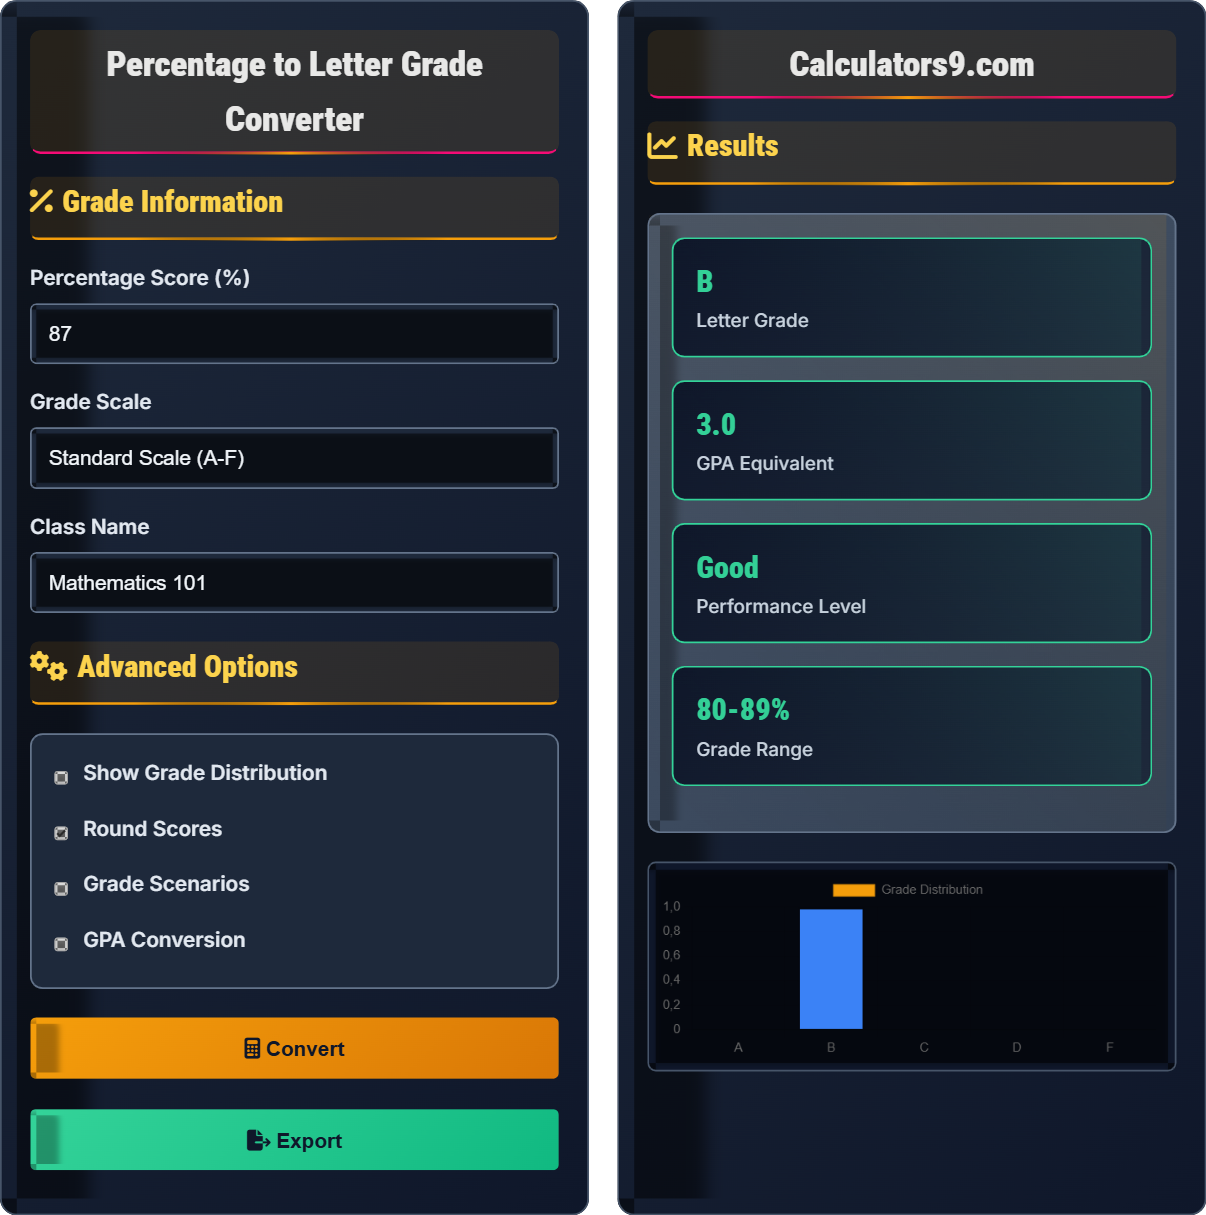
Example: Converting 87% using the standard scale:
87% falls in the 87-89% range → B+
Thus, 87% = B+.
Grade Information
Advanced Options
Results
| Scale | Grade | Range | Performance |
|---|
| Score | Letter | GPA | Performance | Difference |
|---|
Comprehensive Grade Conversion Guide
Grade conversion is the process of mapping numerical percentage scores to letter grades according to predetermined academic standards. This standardization allows for consistent evaluation and communication of academic performance across different educational institutions and contexts. Understanding grade conversion helps students interpret their performance and set academic goals.
Common grade conversion scales used in educational institutions:
Common GPA conversion standards:
- A+ (97-100%): 4.0 GPA - Excellent performance
- A (93-96%): 4.0 GPA - Excellent performance
- A- (90-92%): 3.7 GPA - Excellent performance
- B+ (87-89%): 3.3 GPA - Good performance
- B (83-86%): 3.0 GPA - Good performance
- B- (80-82%): 2.7 GPA - Good performance
- C+ (77-79%): 2.3 GPA - Average performance
- C (73-76%): 2.0 GPA - Average performance
- Understand Your Scale: Know which scale your institution uses
- Compare to Class Average: Contextualize your performance
- Track Progress: Monitor improvement over time
- Set Goals: Use grade equivalents to set targets
- Plan Ahead: Calculate what's needed for desired grades
Grade Conversion
Mapping numerical scores to letter grades.
\(LG = f(P)\)
Where LG=letter grade, P=percentage, f=function.
- Standard scale: A=90-100%, B=80-89%, etc.
- Plus/minus scales add granularity
- GPA conversion varies by institution
Interpretation
Performance level indicated by grade.
- Know your institution's scale
- Compare to class average
- Track improvement over time
- Set achievable goals
- Grade scales vary by institution
- Context affects interpretation
- Percentile ranking matters
- GPA conversion may differ
Grade Conversion Learning Quiz
According to the standard plus-minus grade scale, what letter grade corresponds to a percentage score of 82%?
The answer is C) B-. According to the standard plus-minus grade scale, B- covers the range of 80-82%. Since 82% falls within this range, it corresponds to a B- letter grade.
Understanding grade ranges is crucial for interpreting academic performance. The standard plus-minus scale divides the letter grades into three subcategories each (e.g., A+, A, A-), providing more granular feedback. Students should memorize or keep reference to their institution's specific scale to accurately interpret their performance.
Grade Scale: System mapping percentage scores to letter grades
Plus-Minus Scale: Scale with subdivisions (A+, A, A-, etc.)
Standard Range: B- typically covers 80-82%
• Standard B- range: 80-82%
• Always check institutional scale
• Grade ranges may vary by school
• Memorize key boundary percentages
• Create a reference chart for quick lookup
• Confusing B+ (87-89%) with B- (80-82%)
• Assuming all schools use the same scale
A student receives a score of 78.5% on an exam. Using the standard plus-minus grade scale, determine the letter grade, GPA equivalent, and performance level. Then calculate how many percentage points the student would need to gain to reach the next higher letter grade (B+) and what percentage score would be needed to achieve an A-.
Part 1: Determining current grade
According to the standard plus-minus scale:
• C+ range: 77-79%
• Since 78.5% falls within this range, the letter grade is C+
• GPA equivalent for C+ is 2.3
• Performance level: Average
Part 2: Points needed for next grade (B+)
• B+ range: 87-89%
• Minimum for B+: 87%
• Points needed: 87 - 78.5 = 8.5 percentage points
Part 3: Score needed for A-
• A- range: 90-92%
• Minimum for A-: 90%
• Points needed: 90 - 78.5 = 11.5 percentage points
Therefore, the student currently has a C+ (2.3 GPA, Average performance). They need to improve by 8.5 percentage points to achieve a B+, and 11.5 percentage points to achieve an A-.
This problem demonstrates how to interpret fractional percentage scores within grade ranges. It also shows how to calculate improvement needed to reach higher grades, which is valuable for setting academic goals. The difference between current performance and target grades helps students understand the effort required for grade improvement.
Grade Boundary: Threshold between grade ranges
Performance Level: Qualitative description of academic achievementImprovement Gap: Difference between current and target scores
• Always round according to institutional policy
• Check exact boundaries for each grade
• GPA conversion may vary by institution
• Calculate improvement needed in advance
• Focus on crossing grade boundaries efficiently
• Misidentifying grade range boundaries
• Incorrectly calculating improvement needed
• Assuming all schools have identical GPA conversions
FAQ
Q: How do I convert my grade if my school uses a different scale?
A: Different schools may use slightly different grade scales. Here's how to handle this:
1. Obtain Your School's Scale: Ask your teacher, check your syllabus, or consult your school handbook for the official grade scale.
2. Compare Scales: Note the differences between the standard scale and your school's scale.
3. Manual Conversion: If using this tool, manually adjust based on your school's specific ranges.
4. GPA Conversion: Schools may also have different GPA conversions (some give 4.0 for A-, others require A).
For example, some schools might have A+ as 98-100%, A as 94-97%, A- as 90-93%, which differs from the standard 97-100%, 93-96%, 90-92% scale.
Always use your institution's official scale for academic planning and reporting.
Q: How do plus/minus grades affect college admissions?
A: Plus/minus grades have varying impacts on college admissions:
Positive Impacts: Plus grades (like A+) can distinguish exceptional performance, while minus grades (like B-) provide more accurate performance indicators than broad letter grades.
Considerations: Admissions officers understand that B+ (typically 3.3 GPA) is different from B- (typically 2.7 GPA), which affects overall GPA calculations.
Context Matters: Admissions committees consider grades within the context of the school's grading policy and curriculum rigor.
Overall Strategy: While plus/minus grades provide more detail, colleges primarily focus on patterns of performance, trend of improvement, and the rigor of courses taken.
Recommendation: Focus on consistent strong performance across all subjects rather than obsessing over individual plus/minus distinctions. However, understanding the difference can help with goal-setting and academic planning.