Energy Savings Calculator
Professional energy efficiency • Home energy audit
Energy Savings Formula:
Show the calculatorAnnual Energy Savings = Baseline Consumption × Efficiency Improvement Percentage
Where:
- Baseline Consumption = Current annual energy usage (kWh or therms)
- Efficiency Improvement = Percentage reduction achieved by improvements
This formula calculates the energy saved annually through efficiency improvements, which can then be converted to cost savings based on utility rates.
Example: For a home using 12,000 kWh annually with 25% efficiency improvement:
Annual Savings = 12,000 × 0.25 = 3,000 kWh
If electricity costs $0.12/kWh, annual savings = 3,000 × $0.12 = $360.
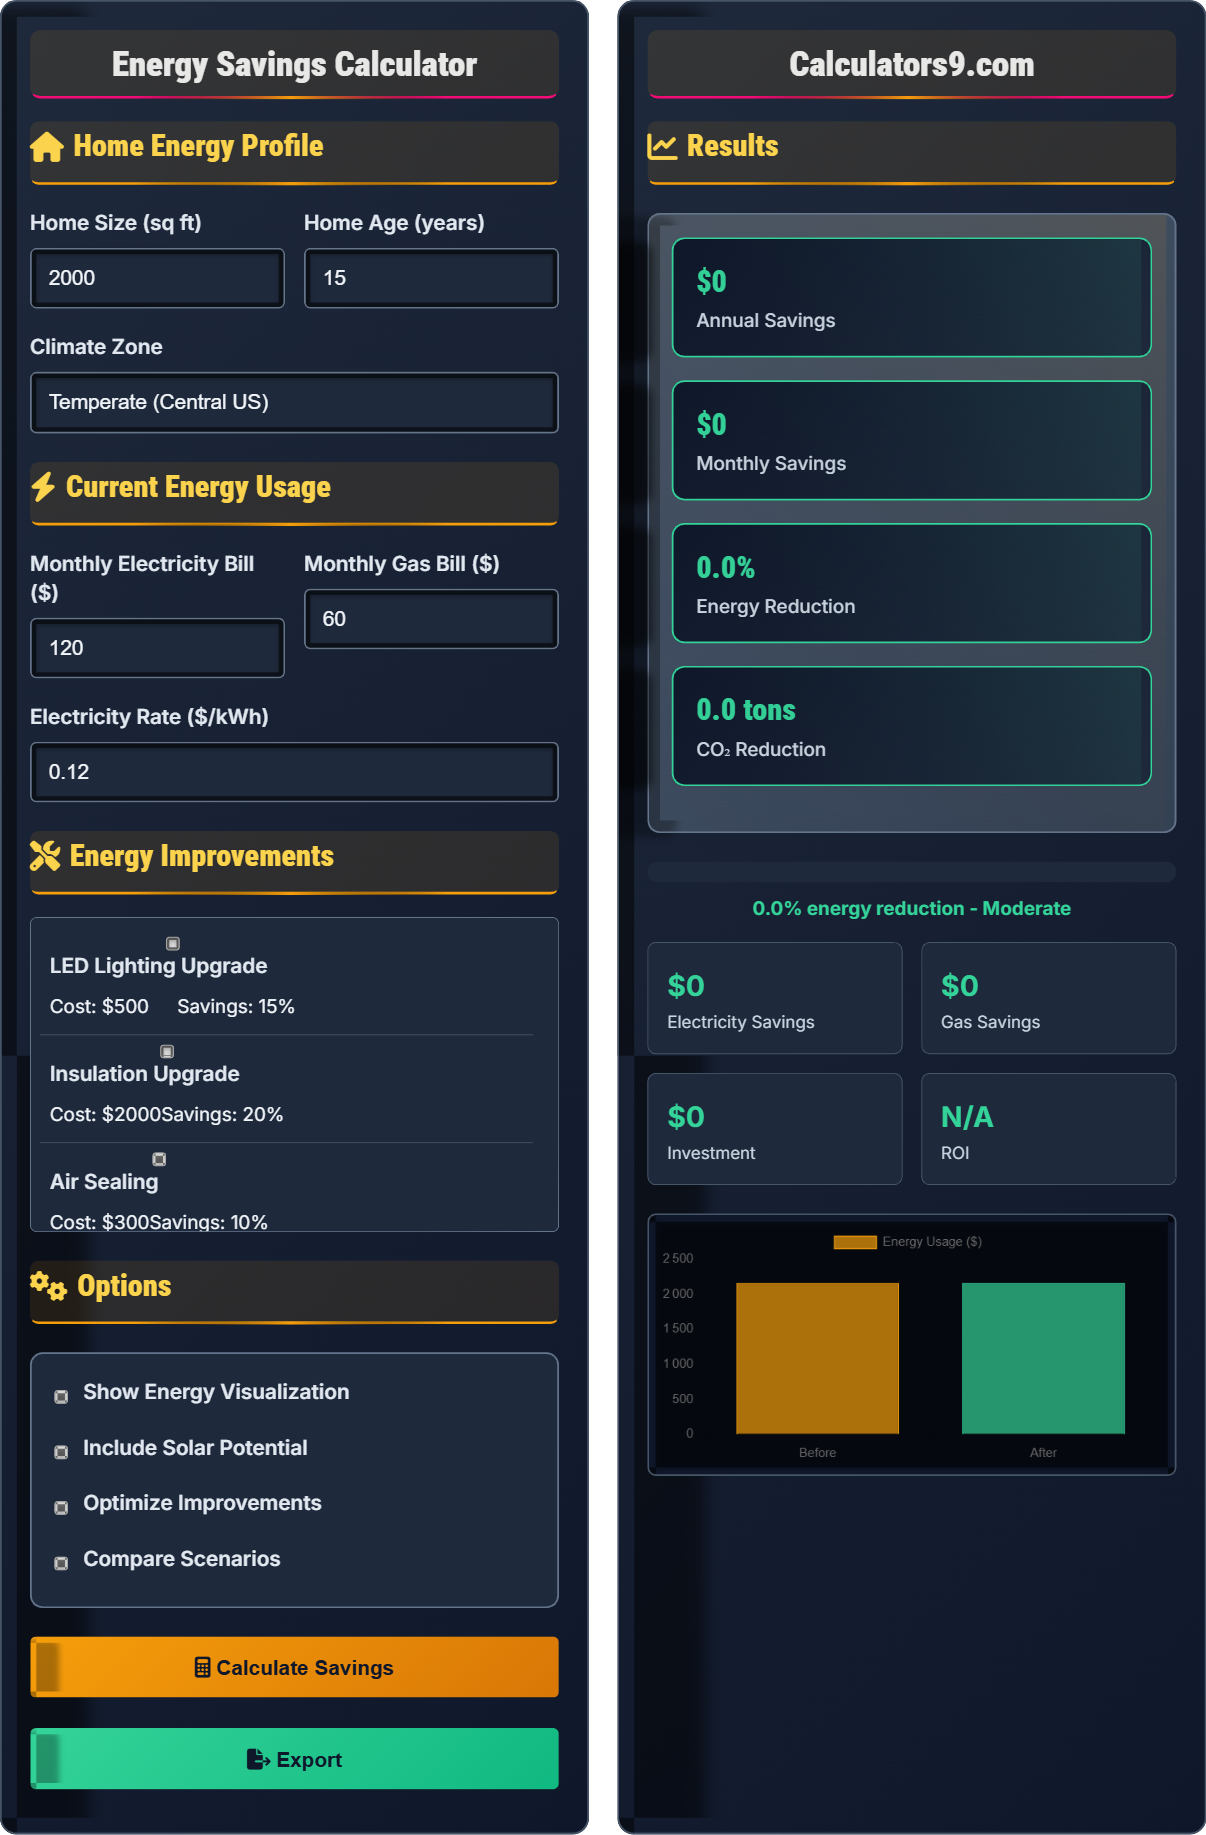
Home Energy Profile
Current Energy Usage
Energy Improvements
Options
Results
| Improvement | Cost | Annual Savings | ROI |
|---|
Comprehensive Home Energy Efficiency Guide
Home energy efficiency refers to optimizing your home's energy use to accomplish the same tasks with less energy consumption. This involves improving insulation, upgrading to efficient appliances, sealing air leaks, and optimizing heating/cooling systems to reduce energy waste while maintaining comfort.
The fundamental calculation for energy savings is:
Where:
- Baseline Consumption: Current annual energy usage in kWh or therms
- Efficiency Improvement: The percentage reduction achieved by improvements
Typical residential energy use breakdown:
- Heating: 42% of total energy use
- Cooling: 9% of total energy use
- Water Heating: 18% of total energy use
- Appliances: 13% of total energy use
- Lighting: 9% of total energy use
- Cooking: 4% of total energy use
- Electronics: 5% of total energy use
- Weather Stripping: ROI of 200-400% in first year
- LED Bulbs: ROI of 100-200% in 1-2 years
- Programmable Thermostat: ROI of 100-150% in 1-3 years
- Insulation: ROI of 100-200% in 3-7 years
- Energy Star Windows: ROI of 75-125% in 10-20 years
Energy Efficiency Fundamentals
Optimizing energy use to accomplish tasks with less energy consumption while maintaining performance.
Annual Savings = Baseline Consumption × Efficiency Improvement
Where improvement is expressed as a decimal (25% = 0.25).
- Heating uses 42% of home energy
- Sealing leaks saves 10-20%
- LEDs use 75% less energy
ROI Calculations
ROI = (Annual Savings × Years) / Investment Cost
- Calculate annual savings
- Divide investment by annual savings
- Result is payback period in years
- ROI typically occurs after payback
- Climate affects energy savings
- Home age impacts improvement effectiveness
- Utility rates affect ROI calculations
- Rebates can improve ROI
Energy Efficiency Learning Quiz
What percentage of total home energy use is typically consumed by heating?
The answer is C) 42%. Heating typically consumes 42% of total home energy use, making it the largest energy expense for most homes. This is followed by water heating (18%), cooling (9%), and appliances (13%). Understanding this distribution helps prioritize energy efficiency improvements for maximum impact.
The energy use breakdown in homes is crucial knowledge for effective energy management. Heating dominates energy consumption because it requires continuous operation during cold months and heat loss through poorly insulated walls, windows, and doors. By understanding that 42% of energy goes to heating, homeowners can prioritize insulation upgrades, weatherization, and efficient heating systems to achieve the greatest savings.
Energy Distribution: How total energy consumption is allocated across different uses
Heating Load: Energy required to maintain indoor temperature
Heat Loss: Energy lost through building envelope
• Heating: 42% of home energy use
• Water heating: 18% of home energy use
• Cooling: 9% of home energy use
• Focus improvements on the largest energy consumers
• Use energy audits to identify usage patterns
• Monitor utility bills for trends
• Ignoring climate-specific energy patterns
• Not prioritizing improvements by impact
Calculate the annual energy savings for a home that uses 12,000 kWh annually after implementing improvements that achieve 25% efficiency gain. If electricity costs $0.12/kWh, what are the annual cost savings? Show your work.
Step 1: Apply Energy Savings Formula = Baseline Consumption × Efficiency Improvement
Annual Energy Savings = 12,000 kWh × 0.25 = 3,000 kWh
Step 2: Calculate Cost Savings = Energy Savings × Utility Rate
Annual Cost Savings = 3,000 kWh × $0.12/kWh = $360
Therefore, the home will save 3,000 kWh annually, resulting in $360 in cost savings.
This calculation demonstrates the direct application of the energy savings formula. The 25% efficiency improvement means the home now achieves the same comfort level using 25% less energy. The conversion from energy savings to cost savings shows the financial benefit of efficiency improvements. This example illustrates how a relatively modest efficiency gain can result in meaningful annual savings.
Energy Savings Formula: Annual Savings = Baseline × Improvement Percentage
Utility Rate: Cost per unit of energy consumed
Efficiency Gain: Percentage reduction in energy use
• Express percentages as decimals in calculations
• Energy savings multiply by utility rate for cost savings
• Larger homes typically have higher absolute savings
• Use annual utility bills to determine baseline consumption
• Consider seasonal variations in energy use
• Factor in future utility rate increases
• Using incorrect utility rates
• Not accounting for seasonal variations
Sarah installs a programmable thermostat for $200 that saves her $60 annually on heating and cooling costs. What is the payback period, and what is the ROI after 5 years? Show your work.
Step 1: Calculate Payback Period = Investment ÷ Annual Savings
Payback Period = $200 ÷ $60 = 3.33 years
Step 2: Calculate Total Savings After 5 Years = Annual Savings × 5
Total Savings = $60 × 5 = $300
Step 3: Calculate ROI = (Total Savings - Investment) ÷ Investment
ROI = ($300 - $200) ÷ $200 = 0.50 or 50%
Therefore, the payback period is 3.33 years, and the ROI after 5 years is 50%.
This problem demonstrates how to evaluate the financial viability of energy improvements. The payback period indicates how long it takes to recover the initial investment, while ROI measures the return after the payback period. The 3.33-year payback for a programmable thermostat is excellent, and the 50% ROI after 5 years shows significant returns. This calculation method helps prioritize improvements based on financial metrics.
Payback Period: Time to recover initial investment
Return on Investment (ROI): Financial return relative to investment
Total Savings: Cumulative savings over time period• Payback Period = Investment ÷ Annual Savings
• ROI = (Total Savings - Investment) ÷ Investment
• Shorter payback periods are generally preferred
• Consider non-financial benefits (comfort, convenience)
• Factor in rebates and incentives
• Compare payback periods across improvements
• Not considering the time value of money
• Ignoring ongoing maintenance costs
John implements multiple energy improvements: LED lighting ($500, saves $150/year), insulation ($2,000, saves $400/year), and a heat pump ($5,000, saves $800/year). What is the combined annual savings, and what is the weighted average payback period?
Step 1: Calculate Combined Annual Savings = Sum of Individual Savings
Combined Savings = $150 + $400 + $800 = $1,350/year
Step 2: Calculate Total Investment = $500 + $2,000 + $5,000 = $7,500
Step 3: Calculate Individual Paybacks:
- LEDs: $500 ÷ $150 = 3.33 years
- Insulation: $2,000 ÷ $400 = 5.0 years
- Heat Pump: $5,000 ÷ $800 = 6.25 years
Step 4: Calculate Weighted Average Payback = (Individual Payback × Investment) ÷ Total Investment
Weighted Payback = (3.33×500 + 5.0×2000 + 6.25×5000) ÷ 7500 = 5.5 years
Combined annual savings: $1,350; Weighted average payback: 5.5 years.
This example shows how to evaluate multiple improvements together. The combined approach leverages synergies between improvements and provides a comprehensive view of investment returns. The weighted average payback considers both the investment amount and payback period, giving more weight to larger investments. This method provides a more realistic assessment of overall project economics than simple averaging.
Combined Improvements: Multiple efficiency measures implemented together
Weighted Average: Average considering the importance of each component
Investment Synergy: Combined benefits exceeding individual benefits
• Combined savings may exceed individual sums due to synergies
• Weighted averages consider investment amounts
• Prioritize improvements with shortest paybacks
• Bundle improvements for contractor discounts
• Look for complementary improvements
• Consider financing options for larger projects
• Not considering implementation costs
• Ignoring potential synergies between improvements
Which of the following improvements typically offers the fastest payback period?
The answer is A) LED lighting. LED lighting typically offers the fastest payback period of 1-2 years due to its low upfront cost and significant energy savings (75% reduction in lighting energy use). While other improvements may offer greater total savings, LEDs provide immediate returns with minimal investment, making them ideal for starting energy efficiency improvements.
Understanding payback periods helps prioritize energy improvements based on financial return. LED lighting stands out for its rapid payback due to the combination of low cost and high efficiency gains. This makes it an excellent starting point for energy efficiency programs, providing quick wins that can fund larger improvements. The lesson here is that sometimes the best investment isn't the one with the highest total savings, but the one with the best risk-adjusted return.
Payback Period: Time to recover initial investment
Investment Priority: Order of implementing improvements
Risk-Adjusted Return: Return considering investment risk
• LED lighting: 1-2 year payback
• Weatherization: 1-3 year payback
• Insulation: 3-7 year payback
• Start with quick-payback improvements
• Use savings to fund larger projects
• Consider financing for high-impact improvements
• Not considering implementation complexity
• Ignoring behavioral changes that complement improvements
FAQ
Q: How do I calculate potential energy savings from home improvements?
A: Use the Energy Savings Formula:
\(\text{Annual Energy Savings} = \text{Baseline Consumption} \times \text{Efficiency Improvement}\)
For example, with 12,000 kWh annual usage and 25% efficiency improvement:
Annual Savings = 12,000 × 0.25 = 3,000 kWh
If electricity costs $0.12/kWh:
Annual Cost Savings = 3,000 × $0.12 = $360
Common improvements and their typical savings:
- Sealing air leaks: 10-20% reduction
- Insulation upgrade: 15-25% reduction
- LED lighting: 75% reduction in lighting energy
- Programmable thermostat: 10-15% reduction
Q: What's the best order to implement energy efficiency improvements?
A: The optimal order considers payback period and system interactions:
- Quick Wins: LED lighting (1-2 year payback)
- Behavioral Changes: Programmable thermostats (2-3 year payback)
- Envelope Improvements: Air sealing and insulation (3-7 year payback)
- Equipment Upgrades: HVAC systems (5-10 year payback)
- Renewable Energy: Solar panels (after efficiency measures)
This sequence maximizes returns and ensures that efficiency improvements work together effectively.