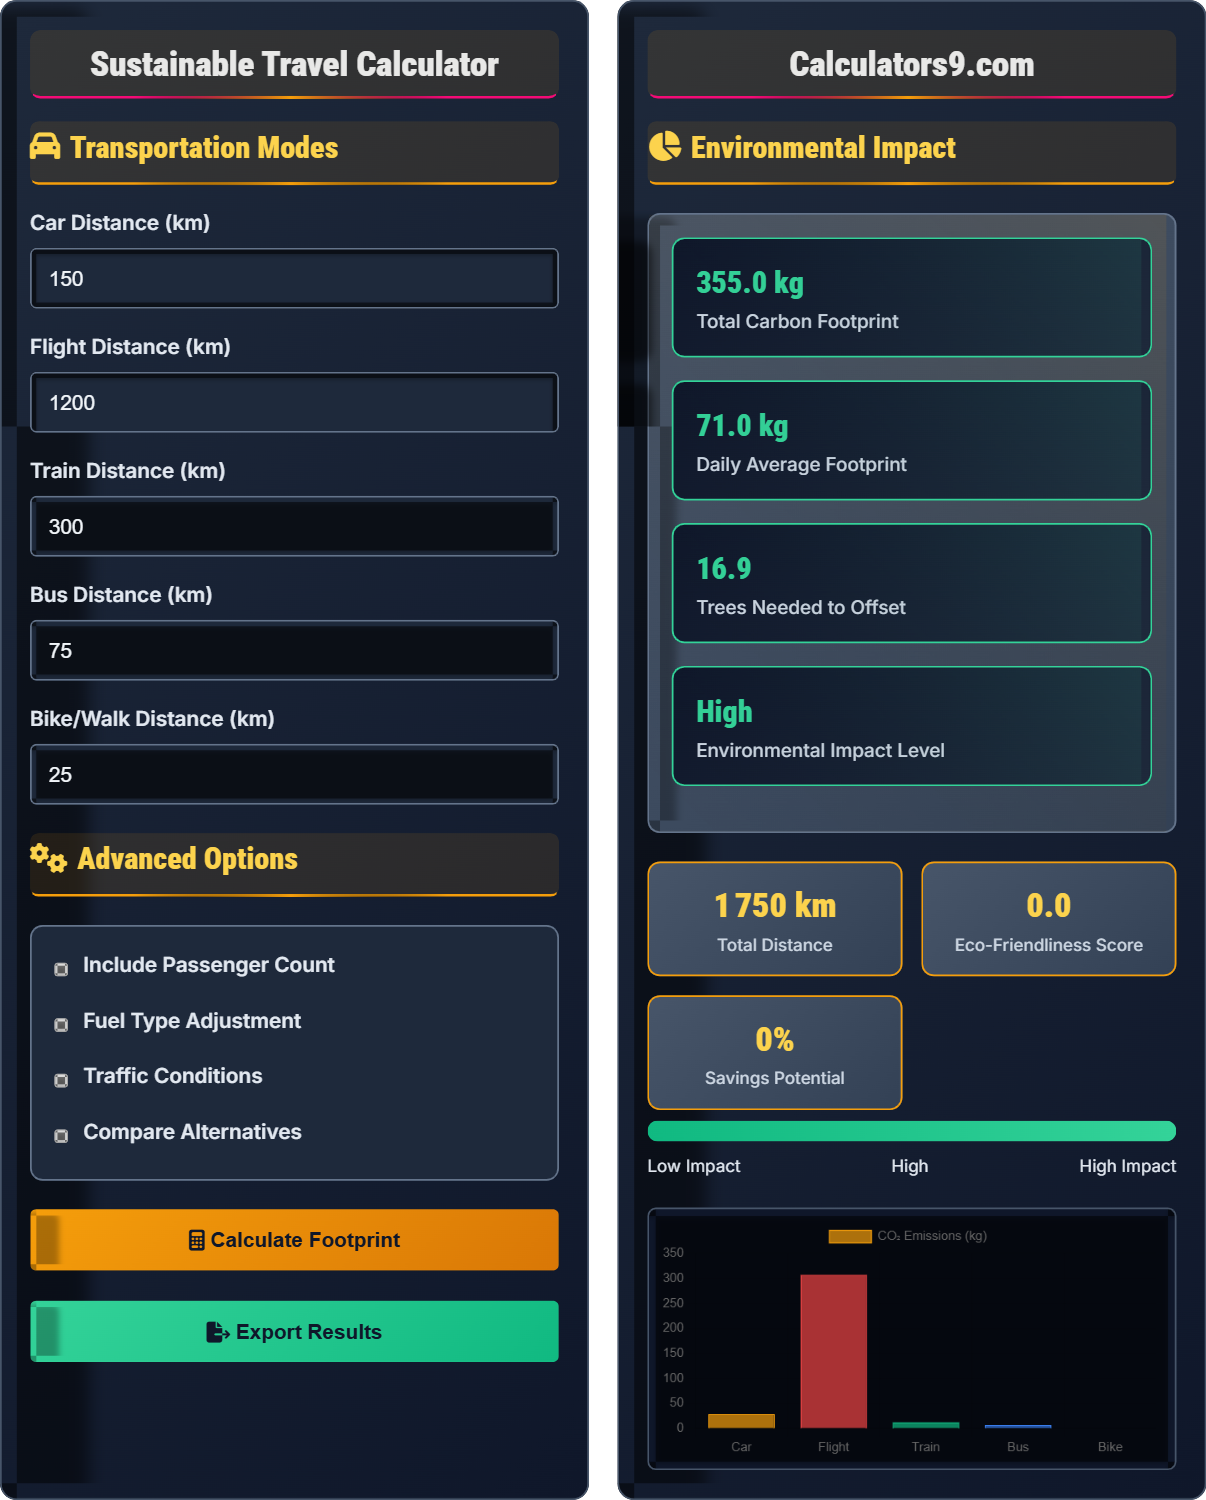
Sustainable Travel Calculator
Eco-friendly transportation tracker • 2026 metrics
Travel Carbon Footprint Formula:
Show the calculator\( CF = \sum (D_i \times E_i \times P_i \times F_i) \)
Where:
- \( CF \) = Total carbon footprint (kg CO₂)
- \( D_i \) = Distance traveled by mode i (km)
- \( E_i \) = Emission factor per km for mode i (kg CO₂/km)
- \( P_i \) = Passenger factor (1 for solo, 0.25 for carpool with 4)
- \( F_i \) = Fuel efficiency factor (0.8-1.2 based on vehicle condition)
This formula calculates the total carbon emissions from various transportation modes based on distance, efficiency, and occupancy. It helps travelers make environmentally conscious decisions.
Example: For a 500km flight (\( E = 0.256 \) kg CO₂/km, \( P = 1 \), \( F = 1.0 \)):
\( CF = 500 \times 0.256 \times 1.0 \times 1.0 = 128 \) kg CO₂
For a 500km train journey (\( E = 0.041 \) kg CO₂/km, \( P = 1 \), \( F = 1.0 \)):
\( CF = 500 \times 0.041 \times 1.0 \times 1.0 = 20.5 \) kg CO₂
Total carbon footprint difference: 107.5 kg CO₂ saved by choosing train.
Transportation Modes
Advanced Options
Environmental Impact
| Mode | Distance | Emissions | % of Total |
|---|
| Mode | Original | Alternative | CO₂ Saved |
|---|
Sustainable Travel Benefits & Tips
Transportation accounts for about 24% of global CO₂ emissions. Here's how different modes compare:
- Walking/Biking: 0 kg CO₂/km
- Electric Train: 0.041 kg CO₂/km
- Bus: 0.089 kg CO₂/km
- Car (petrol): 0.192 kg CO₂/km
- Domestic Flight: 0.256 kg CO₂/km
Follow these guidelines for sustainable travel:
- Combine trips to reduce total distance
- Choose public transportation when possible
- Walk or bike for short distances
- Consider electric vehicles for longer trips
- Plan efficient routes to avoid traffic
Understanding the long-term environmental benefits of sustainable travel:
- One round-trip flight from NYC to London emits ~1.2 tons CO₂
- Switching to public transport can reduce emissions by 45%
- Electric vehicles produce 50-70% fewer emissions than gasoline cars
- Walking/biking trips eliminate all transportation emissions
- Telecommuting reduces travel-related emissions by 100%
Eco-Friendly Transportation Options
Sustainable Travel & Carbon Footprint Quiz
Which mode of transportation has the lowest carbon emissions per kilometer?
The answer is C) Walking/Biking. Walking and biking produce 0 kg of CO₂ per kilometer, making them the most environmentally friendly transportation options. These modes not only eliminate transportation emissions but also provide health benefits. Electric bikes offer similar environmental benefits while providing assistance for longer distances or challenging terrain.
Understanding the relative emissions of different transportation modes helps travelers make informed decisions. The significant difference between zero-emission options like walking and high-emission options like flying illustrates the impact of transportation choices on environmental footprint. Even small shifts toward lower-emission modes can have substantial cumulative benefits.
Carbon Emissions: Release of carbon dioxide into the atmosphere
Emission Factor: Amount of CO₂ emitted per unit of distance traveled
Transportation Mode: Method of moving from one location to another
• Walking and biking produce zero direct emissions
• Public transportation is more efficient per passenger than private vehicles
• Air travel has the highest per-kilometer emissions
• Remember: Walking and biking = 0 emissions
• Use the mnemonic "Walk First, Drive Last" for eco-friendly choices
• Combine short trips into one efficient journey
• Underestimating the environmental impact of air travel
• Assuming all motorized transport has similar emissions
• Not considering passenger capacity in emission calculations
If you drive 200km in a petrol car (0.192 kg CO₂/km) with 2 passengers, what is the per-person carbon footprint? Show your work.
Step 1: Total emissions = 200km × 0.192 kg CO₂/km = 38.4 kg CO₂
Step 2: Per-person emissions = 38.4 kg CO₂ ÷ 2 passengers = 19.2 kg CO₂/person
Therefore, each person's carbon footprint is 19.2 kg CO₂ for the 200km journey.
This calculation demonstrates the importance of considering passenger count when evaluating transportation emissions. Carpooling significantly reduces per-person emissions by distributing the total emissions across multiple passengers. This principle applies to all shared transportation modes and highlights the environmental benefit of ride-sharing.
Per-Person Emissions: Carbon emissions divided by number of passengers
Carpooling: Sharing a vehicle with multiple passengers
Shared Transportation: Modes where emissions are distributed among users
• Per-person emissions = Total emissions ÷ Number of passengers
• More passengers = Lower per-person emissions
• Shared transportation is always more efficient per person
• Always divide total emissions by passenger count
• Encourage carpooling to reduce per-person emissions
• Public transit maximizes passenger count efficiency
• Calculating total emissions instead of per-person emissions
• Forgetting to account for passenger count
• Comparing solo driving to multi-passenger public transport unfairly
You're traveling 500km for a trip. Flying would take 1 hour but emit 128kg CO₂. Taking the train would take 6 hours but emit only 20.5kg CO₂. What percentage of emissions would you save by choosing the train? Show your calculations.
Step 1: Emissions saved = 128kg CO₂ (flight) - 20.5kg CO₂ (train) = 107.5kg CO₂
Step 2: Percentage saved = (107.5kg ÷ 128kg) × 100% = 84.0%
By choosing the train, you would save approximately 84% of the carbon emissions compared to flying.
This calculation highlights the dramatic difference in emissions between air travel and rail travel. While air travel offers time savings, it comes with significantly higher environmental costs. The 84% reduction demonstrates how transportation mode choice can have a substantial impact on personal carbon footprints, especially for medium-distance travel.
Emission Savings: Difference in carbon emissions between two options
Transportation Trade-offs: Balancing time, cost, and environmental impact
Modal Shift: Changing from one transportation mode to another
• Percentage saved = (difference ÷ original) × 100%
• Air travel has disproportionately high emissions
• Rail travel is often more efficient for medium distances
• Use trains for distances under 800km when possible
• Consider overnight trains to save time
• Factor in airport time when comparing door-to-door travel
• Calculating percentage based on the smaller number instead of the original
• Not considering the full travel time including airport procedures
• Assuming all transportation modes have similar emissions
You need to travel 300km to visit family. Your car emits 0.192 kg CO₂/km, your electric car emits 0.07 kg CO₂/km, and the train emits 0.041 kg CO₂/km. If you can choose between driving your petrol car solo, driving your electric car solo, or taking the train, which option minimizes your carbon footprint? Calculate emissions for each option.
Petrol car: 300km × 0.192 kg CO₂/km = 57.6 kg CO₂
Electric car: 300km × 0.07 kg CO₂/km = 21.0 kg CO₂
Train: 300km × 0.041 kg CO₂/km = 12.3 kg CO₂
The train option minimizes carbon footprint at 12.3 kg CO₂, followed by the electric car at 21.0 kg CO₂, and the petrol car at 57.6 kg CO₂.
This optimization problem demonstrates the relative environmental impacts of different transportation technologies. Electric vehicles offer significant emissions reductions compared to conventional cars, but public transportation like trains often provides the lowest emissions option. The calculation shows how technology improvements and modal choices both contribute to reducing environmental impact.
Route Optimization: Choosing the most efficient path or mode of travel
Technology Impact: Effect of vehicle technology on emissions
Modal Choice: Decision about which transportation mode to use
• Compare emissions across all viable options
• Consider both technology and mode when evaluating impact
• Public transportation often has lowest per-person emissions
• Calculate emissions for each option before deciding
• Consider infrastructure availability when planning
• Factor in convenience alongside environmental impact
• Assuming newer technology automatically equals lowest emissions
• Not comparing all available options
• Forgetting to account for passenger count in comparisons
Which of the following statements about transportation emissions is TRUE?
The answer is B) Transportation accounts for 24% of global emissions. The transportation sector is responsible for approximately 24% of direct CO₂ emissions from fuel combustion globally. Road transport (cars, trucks, buses) accounts for about 75% of transportation emissions, while aviation accounts for approximately 12%. This makes transportation a critical sector for climate action.
This statistic puts transportation emissions in global context. The 24% figure shows that transportation is a major contributor to climate change, second only to electricity and heat production. Understanding these proportions helps prioritize efforts to reduce emissions. The breakdown by mode shows that road transport, which includes personal vehicles, is the largest contributor within transportation.
Global Emissions: Total greenhouse gases released worldwide
Transportation Sector: All emissions from moving people and goods
Direct Emissions: Greenhouse gases released from fuel combustion
• Transportation is a major source of global emissions
• Road transport dominates transportation emissions
• Individual choices can have significant collective impact
• Remember: Transportation = 24% of global emissions
• Road transport is the largest component
• Every mode shift contributes to collective reduction
• Underestimating the scale of transportation emissions
• Assuming aviation is the largest transportation contributor
• Not recognizing the cumulative impact of individual choices
FAQ
Q: How does sustainable travel compare to other carbon reduction methods in terms of effectiveness?
A: Sustainable travel is one of the most impactful personal carbon reduction strategies:
- Effectiveness: Transportation accounts for 24% of global emissions, making it a critical area for impact.
- Immediate Impact: Changes in travel behavior immediately reduce emissions.
- Scalability: Individual changes can scale to significant societal impact.
- Cost-Effective: Many sustainable options (walking, cycling, public transport) are cheaper than driving.
Mathematically, if \( E_t \) is transportation emissions and \( E_p \) is personal emissions:
\( \text{Reduction} = E_t \times \text{mode factor} \)
Switching from flying to train travel can reduce emissions by 80-90% for medium distances.
Q: What's the most effective strategy for minimizing travel-related carbon emissions?
A: The most effective approach combines several strategies:
- Mode Selection: Choose public transport, walking, or cycling over driving when possible
- Route Planning: Optimize routes to minimize distance and avoid traffic
- Consolidation: Combine multiple errands into single trips
- Vehicle Choice: Use electric or hybrid vehicles when driving is necessary
- Frequency: Reduce unnecessary trips through virtual meetings and local activities
Research indicates that combining these strategies can reduce transportation emissions by 40-60% compared to conventional travel patterns.