Energy Savings from Upgrades Calculator
Home energy efficiency analysis • 2026 rates
Energy Savings Formula:
Show the calculator\( S = (E_b - E_a) \times C \times T \)
Where:
- \( S \) = Annual energy savings
- \( E_b \) = Energy consumption before upgrade
- \( E_a \) = Energy consumption after upgrade
- \( C \) = Cost per unit of energy
- \( T \) = Time period (hours/year)
This formula calculates the energy and cost savings achieved through efficiency improvements.
Example: For a home consuming 12,000 kWh/year before upgrades and 8,000 kWh/year after, with electricity at $0.12/kWh:
\( S = (12000 - 8000) \times 0.12 = 4000 \times 0.12 = 480 \)
Therefore, annual savings would be $480.
Home Energy Profile
Upgrade Options
Advanced Options
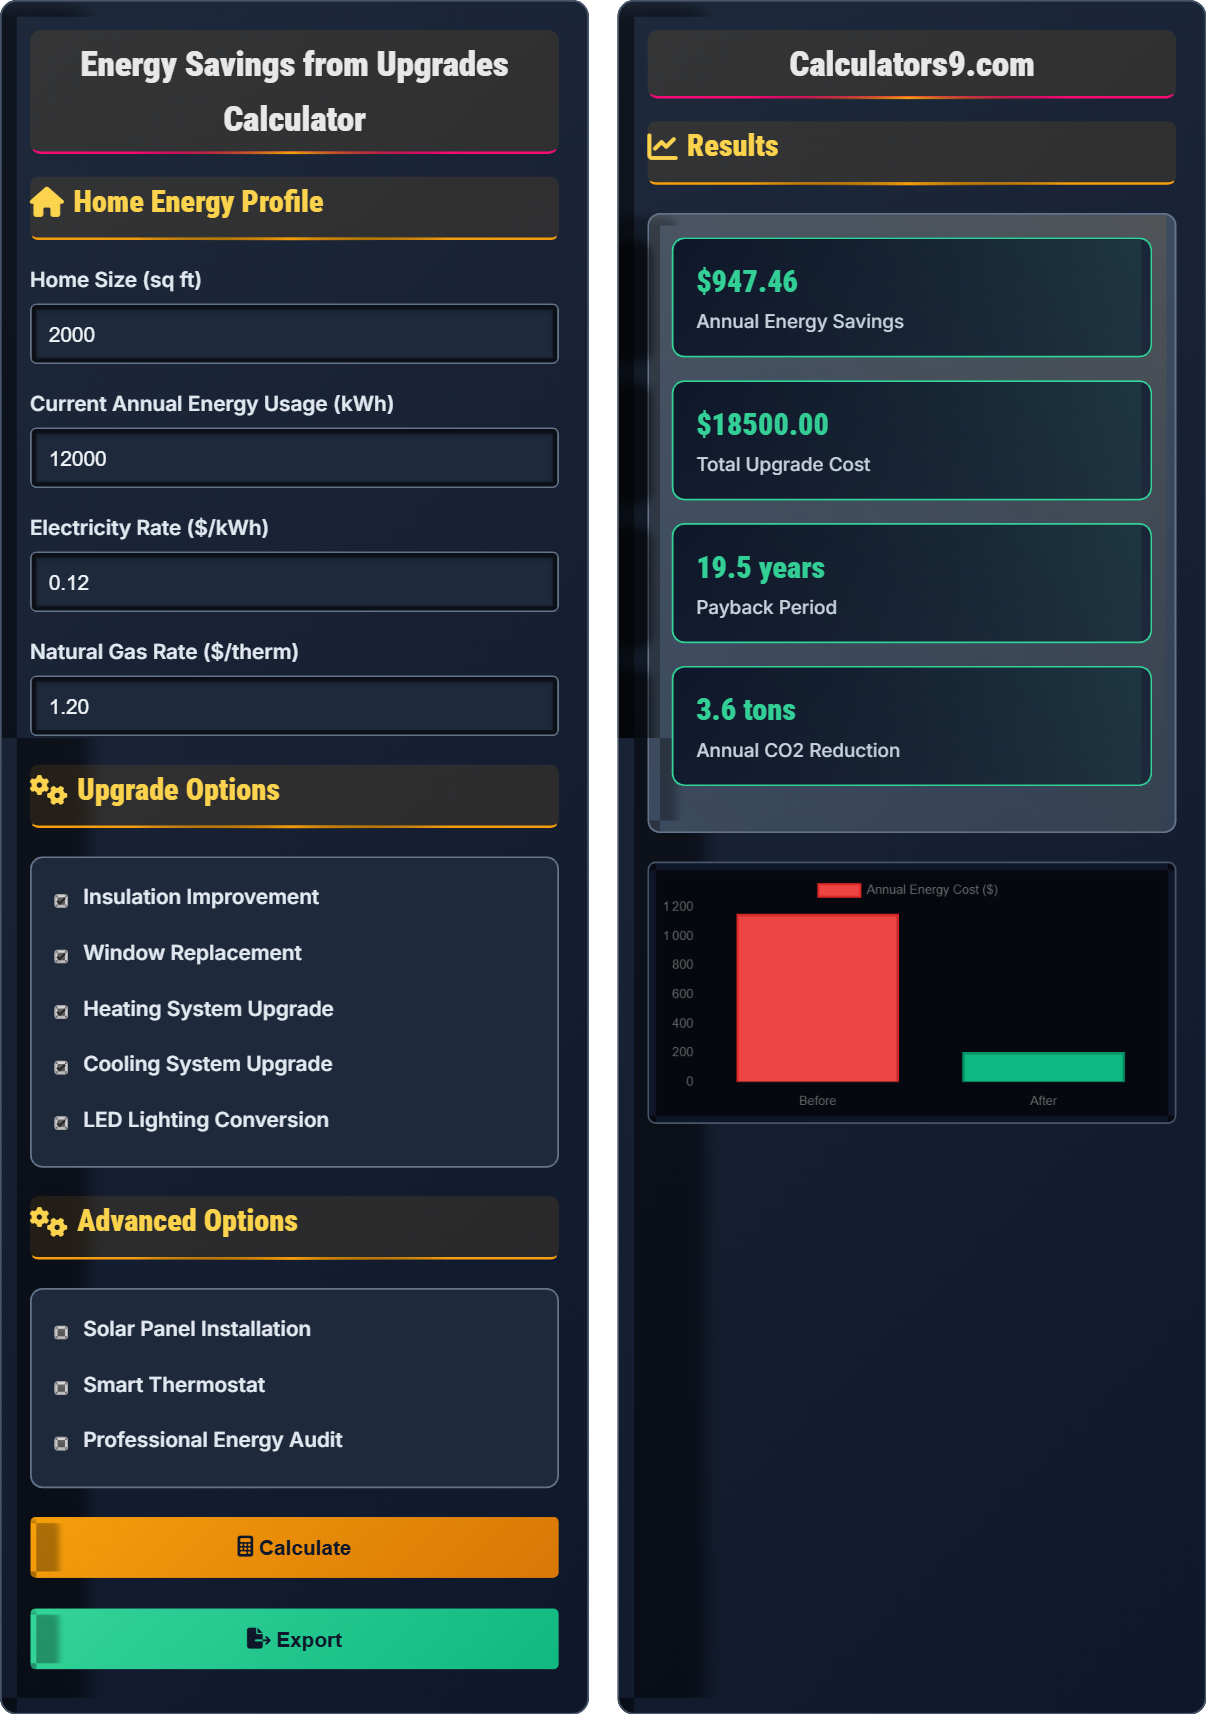
Results
| Upgrade | Energy Saved | Cost Saved | Payback |
|---|
| Year | Energy Cost | Cumulative Savings | Net Benefit |
|---|
Comprehensive Energy Efficiency Guide
Energy efficiency upgrades reduce consumption while maintaining comfort and functionality. These improvements typically pay for themselves through reduced energy bills while contributing to environmental sustainability. The average home can reduce energy consumption by 20-30% through strategic upgrades.
Energy savings are calculated based on consumption reduction:
Additional factors include time of use rates and seasonal variations.
Energy efficiency reduces carbon footprint significantly:
- CO2 Reduction: Each kWh saved prevents ~0.9 lbs of CO2 emissions
- Resource Conservation: Less energy demand reduces resource extraction
- Grid Stability: Reduced peak demand improves grid reliability
- Water Conservation: Power plants consume water for cooling
- Land Preservation: Less need for new power infrastructure
- Energy Audit First: Identify priority improvements
- Sequencing: Start with high-impact, low-cost upgrades
- Professional Installation: Ensures optimal performance
- Maintenance: Keep systems running efficiently
- Monitoring: Track actual vs expected savings
Energy Efficiency Basics
Using less energy to perform the same function.
\( S = (E_b - E_a) \times C \times T \)
Where S=savings, Eb=baseline energy, Ea=post-upgrade energy, C=cost, T=time.
- Simple upgrades often have best ROI
- Proper installation crucial
- Combine with behavioral changes
Strategies
Maximize savings with strategic upgrades.
- Energy audit to identify priorities
- Low-cost, high-impact upgrades first
- Major systems improvements
- Renewable energy integration
- Climate affects savings
- Rebate programs available
- Professional assessment recommended
- Energy monitoring valuable
Energy Efficiency Learning Quiz
Which of the following is the best definition of energy efficiency?
The answer is B) Using less energy to perform the same function. Energy efficiency means achieving the same outcome (comfort, light, transportation) while consuming less energy. This is different from simply reducing energy use without maintaining performance.
Energy efficiency is about optimization rather than reduction. A high-efficiency refrigerator maintains the same cooling capability while using less electricity. Similarly, LED bulbs provide the same light output while consuming 75-80% less energy than incandescent bulbs.
Energy Efficiency: Using less energy to accomplish the same task
Performance: The functional output of an energy-consuming device
Optimization: Improving the ratio of output to input
• Efficiency = Performance ÷ Energy Input
• Maintain function while reducing consumption
• Focus on output-to-input ratios
• Remember: Efficiency = Same output, less energy
• Look for ENERGY STAR certifications
• Compare efficiency ratings when shopping
• Confusing efficiency with conservation
• Thinking efficiency means doing less
• Ignoring performance when evaluating efficiency
Calculate the annual energy savings for a home that reduces usage from 12,000 kWh to 8,000 kWh annually, with electricity costing $0.12/kWh. Show your work.
Using the energy savings formula: S = (Eb - Ea) × C
Where:
- Eb = 12,000 kWh (baseline usage)
- Ea = 8,000 kWh (post-upgrade usage)
- C = $0.12/kWh (electricity rate)
Step 1: Calculate energy reduction = 12,000 - 8,000 = 4,000 kWh
Step 2: Calculate cost savings = 4,000 kWh × $0.12/kWh = $480
Therefore, annual energy savings are $480.
This calculation demonstrates the direct relationship between energy consumption reduction and cost savings. The formula multiplies the energy saved by the cost per unit of energy. This simple calculation forms the basis for evaluating the financial benefits of efficiency improvements.
Baseline Usage: Energy consumption before improvements
Post-Upgrade Usage: Energy consumption after improvements
Energy Rate: Cost per unit of energy consumed
• Subtract post-upgrade from baseline to find reduction
• Multiply energy reduction by energy rate
• Include all relevant energy sources in calculations
• Use annual utility bills for baseline data
• Consider seasonal variations in usage
• Include gas, electric, and other energy sources
• Using wrong time periods in calculations
• Forgetting to include all energy sources
• Not accounting for seasonal variations
Sarah installs insulation ($2,000) and replaces windows ($5,000) in her 2,500 sq ft home. The insulation reduces energy use by 15% and new windows by 10%. If her annual energy bill was $2,400, what is her payback period?
Step 1: Calculate total upgrade cost = $2,000 + $5,000 = $7,000
Step 2: Calculate energy savings from insulation = $2,400 × 0.15 = $360
Step 3: Calculate energy savings from windows = $2,400 × 0.10 = $240
Step 4: Calculate total annual savings = $360 + $240 = $600
Step 5: Calculate payback period = $7,000 ÷ $600 = 11.67 years
Therefore, the payback period is approximately 11.7 years.
This example shows how to analyze combined upgrades. The savings from each improvement add together to create the total benefit. Payback period is calculated by dividing total investment by annual savings. In this case, the 11.7-year payback is reasonable for building improvements that last 20-30 years.
Payback Period: Time to recover investment through savings
Combined Effect: Total savings from multiple improvements
Investment Recovery: When cumulative savings equal initial cost
• Add savings from individual improvements
• Payback = Total cost ÷ Annual savings
• Consider lifetime of improvements
• Calculate payback for each improvement
• Consider cumulative effects of improvements
• Factor in increased home value
• Not adding savings from different improvements
• Using incorrect division in payback calculation
• Forgetting to consider improvement lifespans
Mike lives in Minnesota where heating dominates energy use (80% of $2,400 bill), while his friend John in Florida spends 70% on cooling ($2,000 bill). Both install high-efficiency HVAC systems saving 30% on their respective energy types. Who sees greater absolute savings?
Minnesota (Mike):
Heating portion: $2,400 × 0.80 = $1,920
Savings: $1,920 × 0.30 = $576
Florida (John):
Cooling portion: $2,000 × 0.70 = $1,400
Savings: $1,400 × 0.30 = $420
Mike saves $576 while John saves $420, so Mike sees greater absolute savings despite lower total energy use.
This demonstrates how regional climate affects the value of efficiency improvements. In Minnesota, where heating costs dominate, improvements to heating efficiency yield greater savings. The percentage savings are the same (30%), but the absolute dollar savings depend on the baseline energy expenditure for that specific use.
Regional Energy Patterns: How climate affects energy use distribution
Absolute Savings: Dollar amount saved, regardless of percentage
Climate Impact: How location affects energy consumption patterns
• Absolute savings depend on baseline costs
• Climate determines primary energy uses
• Target improvements to dominant energy uses
• Analyze your energy use breakdown
• Focus on dominant energy use categories
• Consider seasonal energy rate variations
• Applying uniform savings across all energy uses
• Not considering regional climate differences
• Ignoring seasonal variations in energy use
Which of the following is TRUE about the environmental impact of energy efficiency improvements?
The answer is B) Each kWh saved prevents about 0.9 lbs of CO2 emissions. On average, electricity generation produces about 0.9 pounds of CO2 per kWh in the US. Therefore, saving 1,000 kWh annually prevents approximately 900 pounds of CO2 emissions.
Energy efficiency has significant environmental benefits. The CO2 emission factor varies by region depending on the energy mix (coal, natural gas, renewables). Efficiency improvements are considered one of the most cost-effective ways to reduce emissions, often cheaper than generating clean energy to meet the same demand.
Emission Factor: Amount of CO2 produced per unit of energy generated
Carbon Footprint: Total greenhouse gas emissions caused by activities
Energy Mix: Sources used to generate electricity in a region
• Each kWh saved equals 0.9 lbs CO2 prevented (US avg)
• Efficiency is often cheaper than clean energy generation
• Regional variations exist in emission factors
• Efficiency improvements have immediate environmental benefits
• Combine efficiency with renewable energy for maximum impact
• Track both financial and environmental returns
• Underestimating environmental benefits of efficiency
• Thinking renewable energy is always better than efficiency
• Not considering regional emission factors
FAQ
Q: How much can I really save by upgrading my home's energy efficiency?
A: Typical homeowners save 20-30% on energy bills through strategic upgrades. Using the formula:
\( S = (E_b - E_a) \times C \)
For a home with $2,400 annual energy bill, a 25% reduction saves:
\( S = (2400 - 1800) \times 1.0 = 600 \)
So $600 annually. The most impactful upgrades are usually insulation, windows, and HVAC systems, which can save 10-40% individually.
Q: What's the environmental impact of energy efficiency upgrades?
A: Energy efficiency has significant environmental benefits. Each kWh saved prevents approximately 0.9 lbs of CO2 emissions in the US average grid. For a home saving 4,000 kWh annually:
4,000 kWh × 0.9 lbs/kWh = 3,600 lbs CO2 prevented
That's equivalent to planting 43 trees or removing 1.8 cars from roads annually. Efficiency improvements are often the most cost-effective emission reduction strategy.