EV Carbon Savings Calculator
Environmental impact analysis • 2026 data
EV Carbon Savings Formula:
Show the calculator\( S = (E_g \times C_g - E_e \times C_e) \times D \)
Where:
- \( S \) = Annual carbon savings (lbs CO2)
- \( E_g \) = Gas vehicle emissions (lbs CO2/gallon)
- \( E_e \) = Electric vehicle emissions (lbs CO2/kWh)
- \( C_g \) = Gas consumption (gallons per mile)
- \( C_e \) = Electric consumption (kWh per mile)
- \( D \) = Annual driving distance (miles)
This formula calculates the annual carbon dioxide savings from switching to an electric vehicle.
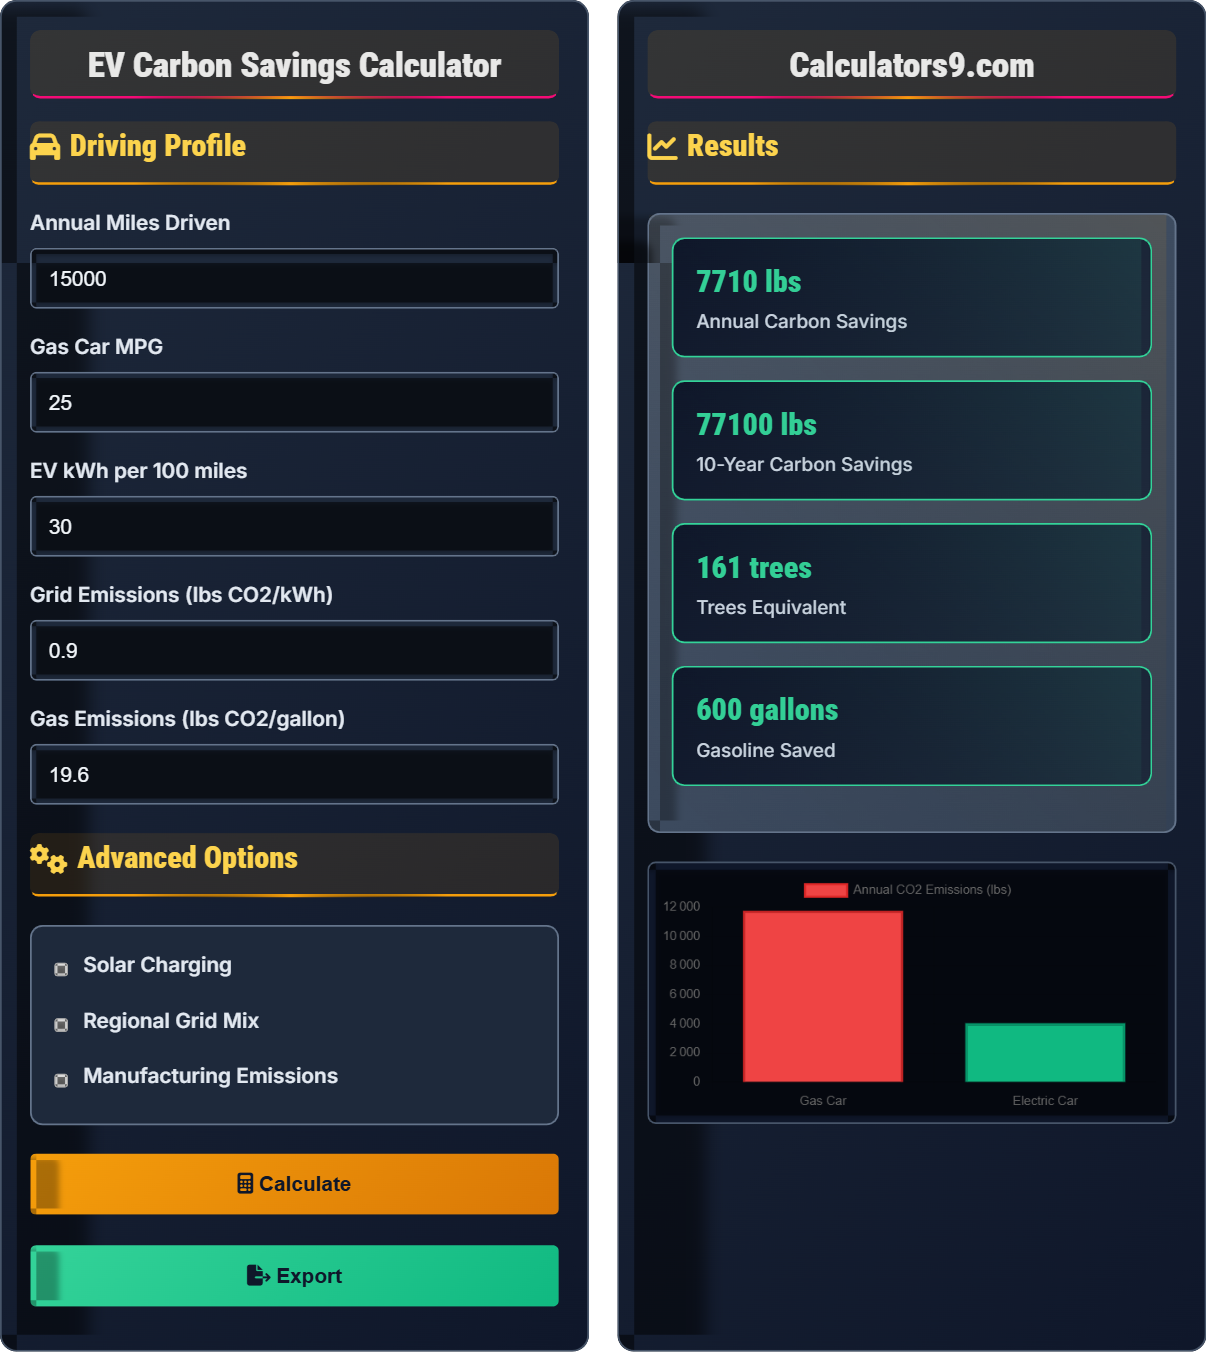
Example: For 15,000 miles/year, gas car 25 MPG (0.04 gal/mile), electric 0.3 kWh/mile, gas emissions 19.6 lbs/gallon, grid emissions 0.9 lbs/kWh:
\( S = (19.6 \times 0.04 - 0.9 \times 0.3) \times 15000 \)
\( S = (0.784 - 0.27) \times 15000 = 0.514 \times 15000 = 7,710 \)
Therefore, annual savings would be 7,710 lbs CO2.
Driving Profile
Advanced Options
Results
| Vehicle | Annual Miles | CO2 Emissions | Reduction |
|---|
| Factor | Gas Car | Electric | Savings |
|---|
Comprehensive EV Environmental Guide
Electric vehicles produce zero direct emissions and increasingly cleaner electricity generation makes them environmentally superior to gas vehicles. Studies show EVs produce 50-70% fewer lifecycle emissions than comparable gas cars, even accounting for manufacturing.
EV carbon savings depend on electricity source:
Where EV emissions account for grid carbon intensity.
Carbon savings vary by electricity source:
- Coal-Dominated Grids: 40-60% less emissions than gas cars
- Renewable-Rich Grids: 70-90% less emissions than gas cars
- Nuclear-Dominated Grids: 60-80% less emissions than gas cars
- California Grid: Among lowest emissions in US
- Texas Grid: Improving as renewables increase
- Off-Peak Charging: Charge during low-demand renewable periods
- Solar Integration: Pair with rooftop solar panels
- Smart Charging: Use apps that optimize for clean energy
- Vehicle Sharing: Maximize utilization of EVs
- Battery Recycling: Support circular economy initiatives
EV Environmental Basics
Measuring environmental impact of vehicle choices.
\( S = (E_g \times C_g - E_e \times C_e) \times D \)
Where S=savings, Eg=gas emissions, Eg=electric emissions, Cg=gas consumption, Ce=electric consumption, D=miles.
- Grid cleanliness affects EV emissions
- Manufacturing impact offsets over time
- Regional variations exist
Strategies
Optimize EV environmental benefits.
- Choose clean electricity sources
- Charge during renewable peaks
- Select efficient EV models
- Maximize vehicle lifespan
- Grid decarbonization timeline
- Manufacturing supply chains
- Battery recycling programs
- End-of-life vehicle recycling
EV Carbon Savings Learning Quiz
Which of the following statements about EV environmental impact is TRUE?
The answer is B) EVs produce 50-70% fewer lifecycle emissions than gas cars. Comprehensive studies show that even when accounting for manufacturing, electricity generation, and end-of-life disposal, EVs produce significantly fewer emissions than comparable gas vehicles over their entire lifecycle.
This question addresses common misconceptions about EV environmental impact. While EV manufacturing does have a higher initial carbon footprint due to battery production, this is quickly offset by the lack of operational emissions. The lifecycle analysis shows EVs are environmentally superior in most regions, with the gap widening as electricity grids become cleaner.
Lifecycle Analysis: Assessment of environmental impact from cradle to grave
Carbon Footprint: Total greenhouse gas emissions caused by activities
Manufacturing Phase: Emissions from producing the vehicle
• Manufacturing impact is offset over vehicle lifetime
• Operational emissions dominate lifecycle impact
• Grid cleanliness affects EV emissions significantly
• Consider regional electricity sources
• Factor in grid decarbonization timeline
• Compare lifecycle rather than just operational emissions
• Only considering manufacturing emissions
• Not accounting for grid improvements over time
• Comparing only tailpipe emissions
Calculate the annual carbon savings for driving 15,000 miles. Gas car gets 25 MPG, EV uses 0.3 kWh/mile. Gas emissions are 19.6 lbs CO2/gallon, grid emissions are 0.9 lbs CO2/kWh. Show your work.
Using the carbon savings formula: S = (Eg × Cg - Ee × Ce) × D
Where:
- Eg = 19.6 lbs CO2/gallon (gas emissions)
- Ee = 0.9 lbs CO2/kWh (grid emissions)
- Cg = 1/25 = 0.04 gallons/mile (gas consumption)
- Ce = 0.3 kWh/mile (electric consumption)
- D = 15,000 miles (driving distance)
Step 1: Gas car emissions per mile = 19.6 × 0.04 = 0.784 lbs CO2/mile
Step 2: EV emissions per mile = 0.9 × 0.3 = 0.27 lbs CO2/mile
Step 3: Emissions difference = 0.784 - 0.27 = 0.514 lbs CO2/mile
Step 4: Annual savings = 0.514 × 15,000 = 7,710 lbs CO2
This calculation demonstrates how to quantify the environmental benefit of switching to an EV. The formula accounts for both the fuel efficiency of each vehicle type and the carbon intensity of the energy sources. This approach provides a standardized way to compare environmental impacts across different vehicle technologies.
Carbon Intensity: Amount of CO2 emitted per unit of energy
Emissions Factor: CO2 released per unit of fuel consumed
Energy Consumption: Fuel needed per mile traveled
• Convert all units to be consistent (miles, gallons, kWh)
• Multiply consumption by emissions factor for total emissions
• Subtract EV emissions from gas emissions for savings
• Use consistent units throughout calculations
• Consider regional variations in grid emissions
• Factor in vehicle efficiency ratings
• Using inconsistent units in calculations
• Forgetting to convert MPG to consumption rate
• Not accounting for different energy sources
Sarah lives in California where grid emissions are 0.4 lbs CO2/kWh, while her friend John lives in Ohio where grid emissions are 1.3 lbs CO2/kWh. Both drive 12,000 miles annually in EVs that consume 0.3 kWh/mile. How do their annual carbon savings compare to gas cars averaging 25 MPG?
First, calculate gas car emissions: (19.6 lbs/gal) × (1/25 gal/mile) × 12,000 miles = 9,408 lbs CO2
California (Sarah):
EV emissions: 0.4 lbs/kWh × 0.3 kWh/mile × 12,000 miles = 1,440 lbs CO2
Savings: 9,408 - 1,440 = 7,968 lbs CO2
Ohio (John):
EV emissions: 1.3 lbs/kWh × 0.3 kWh/mile × 12,000 miles = 4,680 lbs CO2
Savings: 9,408 - 4,680 = 4,728 lbs CO2
Sarah saves 3,240 lbs more CO2 annually than John due to cleaner grid electricity.
This example illustrates how regional electricity sources significantly impact EV environmental benefits. In California, with a high proportion of renewables and nuclear power, EVs achieve maximum environmental benefits. In Ohio, with a higher proportion of coal generation, benefits are reduced but still substantial compared to gas cars.
Grid Mix: Proportion of different energy sources in electricity generation
Regional Variations: Differences in electricity carbon intensity by location
Electricity Decarbonization: Shift toward cleaner electricity sources
• Grid emissions vary significantly by region
• Cleaner grids maximize EV benefits
• Grid mix is improving over time
• Research your regional grid emissions
• Consider grid decarbonization timeline
• Factor in renewable energy options
• Using national averages instead of local data
• Not considering grid improvement trends
• Ignoring regional electricity sources
Mike drives 15,000 miles annually in an EV that consumes 0.3 kWh/mile. Without solar, his EV emits 0.9 lbs CO2/kWh from the grid. With 50% solar charging, his effective emissions drop to 0.45 lbs CO2/kWh (solar=0 emissions). What are his additional annual carbon savings from solar integration?
Without solar:
Emissions = 0.9 lbs/kWh × 0.3 kWh/mile × 15,000 miles = 4,050 lbs CO2
With 50% solar:
Effective emissions rate = (0.5 × 0) + (0.5 × 0.9) = 0.45 lbs/kWh
Emissions = 0.45 lbs/kWh × 0.3 kWh/mile × 15,000 miles = 2,025 lbs CO2
Additional savings from solar = 4,050 - 2,025 = 2,025 lbs CO2 annually
Total savings compared to gas car = 9,408 - 2,025 = 7,383 lbs CO2
This demonstrates how renewable energy integration amplifies EV environmental benefits. By combining EVs with clean electricity sources like solar, the environmental impact is further reduced. This synergistic effect maximizes the carbon reduction potential of both technologies.
Effective Emissions Rate: Weighted average of different electricity sources
Solar Integration: Using renewable energy to charge EVs
Synergistic Benefits: Combined effects greater than individual impacts
• Effective emissions = (solar % × 0) + (grid % × grid emissions)
• Renewable charging maximizes EV benefits
• Clean electricity amplifies EV advantages
• Pair EVs with renewable energy when possible
• Consider time-of-use rates for clean energy
• Look for green energy programs
• Not accounting for renewable energy in calculations
• Assuming all grid electricity has same emissions
• Forgetting to weight different energy sources
Which of the following is TRUE about EV manufacturing emissions?
The answer is B) Manufacturing impact is offset within 6-18 months of driving. Studies show that the higher emissions from EV manufacturing (mainly from battery production) are typically offset by the lack of operational emissions within 6-18 months of driving, depending on the electricity source.
This addresses a common concern about EV environmental impact. While EVs do have higher manufacturing emissions due to battery production, the operational emissions savings quickly compensate for this. Over the typical 10-15 year vehicle lifetime, EVs achieve significantly better environmental performance than gas cars.
Manufacturing Phase: Emissions from producing the vehicle and components
Offset Period: Time needed to compensate for manufacturing emissionsLifecycle Impact: Total emissions over vehicle lifetime
• Manufacturing impact is temporary
• Operational emissions dominate lifecycle impact
• Offset occurs within 1-2 years of driving
• Consider vehicle lifetime when evaluating manufacturing impact
• Focus on lifecycle rather than just manufacturing
• Account for battery recycling benefits
• Equating manufacturing emissions with total impact
• Not considering offset timeline
• Ignoring operational emissions savings
FAQ
Q: How much carbon can I save by switching to an EV?
A: Using the formula: \( S = (E_g \times C_g - E_e \times C_e) \times D \)
For 15,000 miles/year, gas car 25 MPG (0.04 gal/mile), EV 0.3 kWh/mile, gas emissions 19.6 lbs/gal, grid emissions 0.9 lbs/kWh:
\( S = (19.6 \times 0.04 - 0.9 \times 0.3) \times 15000 = 7,710 \) lbs CO2 annually
This equals approximately 3.5 tons of CO2 saved annually, equivalent to planting 42 trees or avoiding burning 3,900 pounds of coal.
Q: Does the electricity source affect EV environmental benefits?
A: Yes, significantly. EV environmental benefits depend on grid carbon intensity:
- Coal-Dominated Grids: ~40% less emissions than gas cars
- Renewable-Rich Grids: ~80% less emissions than gas cars
- California Grid: 0.4 lbs CO2/kWh (maximum benefits)
- Texas Grid: 0.9 lbs CO2/kWh (improving)
Even in coal-heavy regions, EVs typically achieve 30-40% fewer emissions than gas cars. As grids decarbonize, EV benefits increase over time.