Charging Time Calculator
EV Charging Duration & Cost Calculator • Electric Mobility
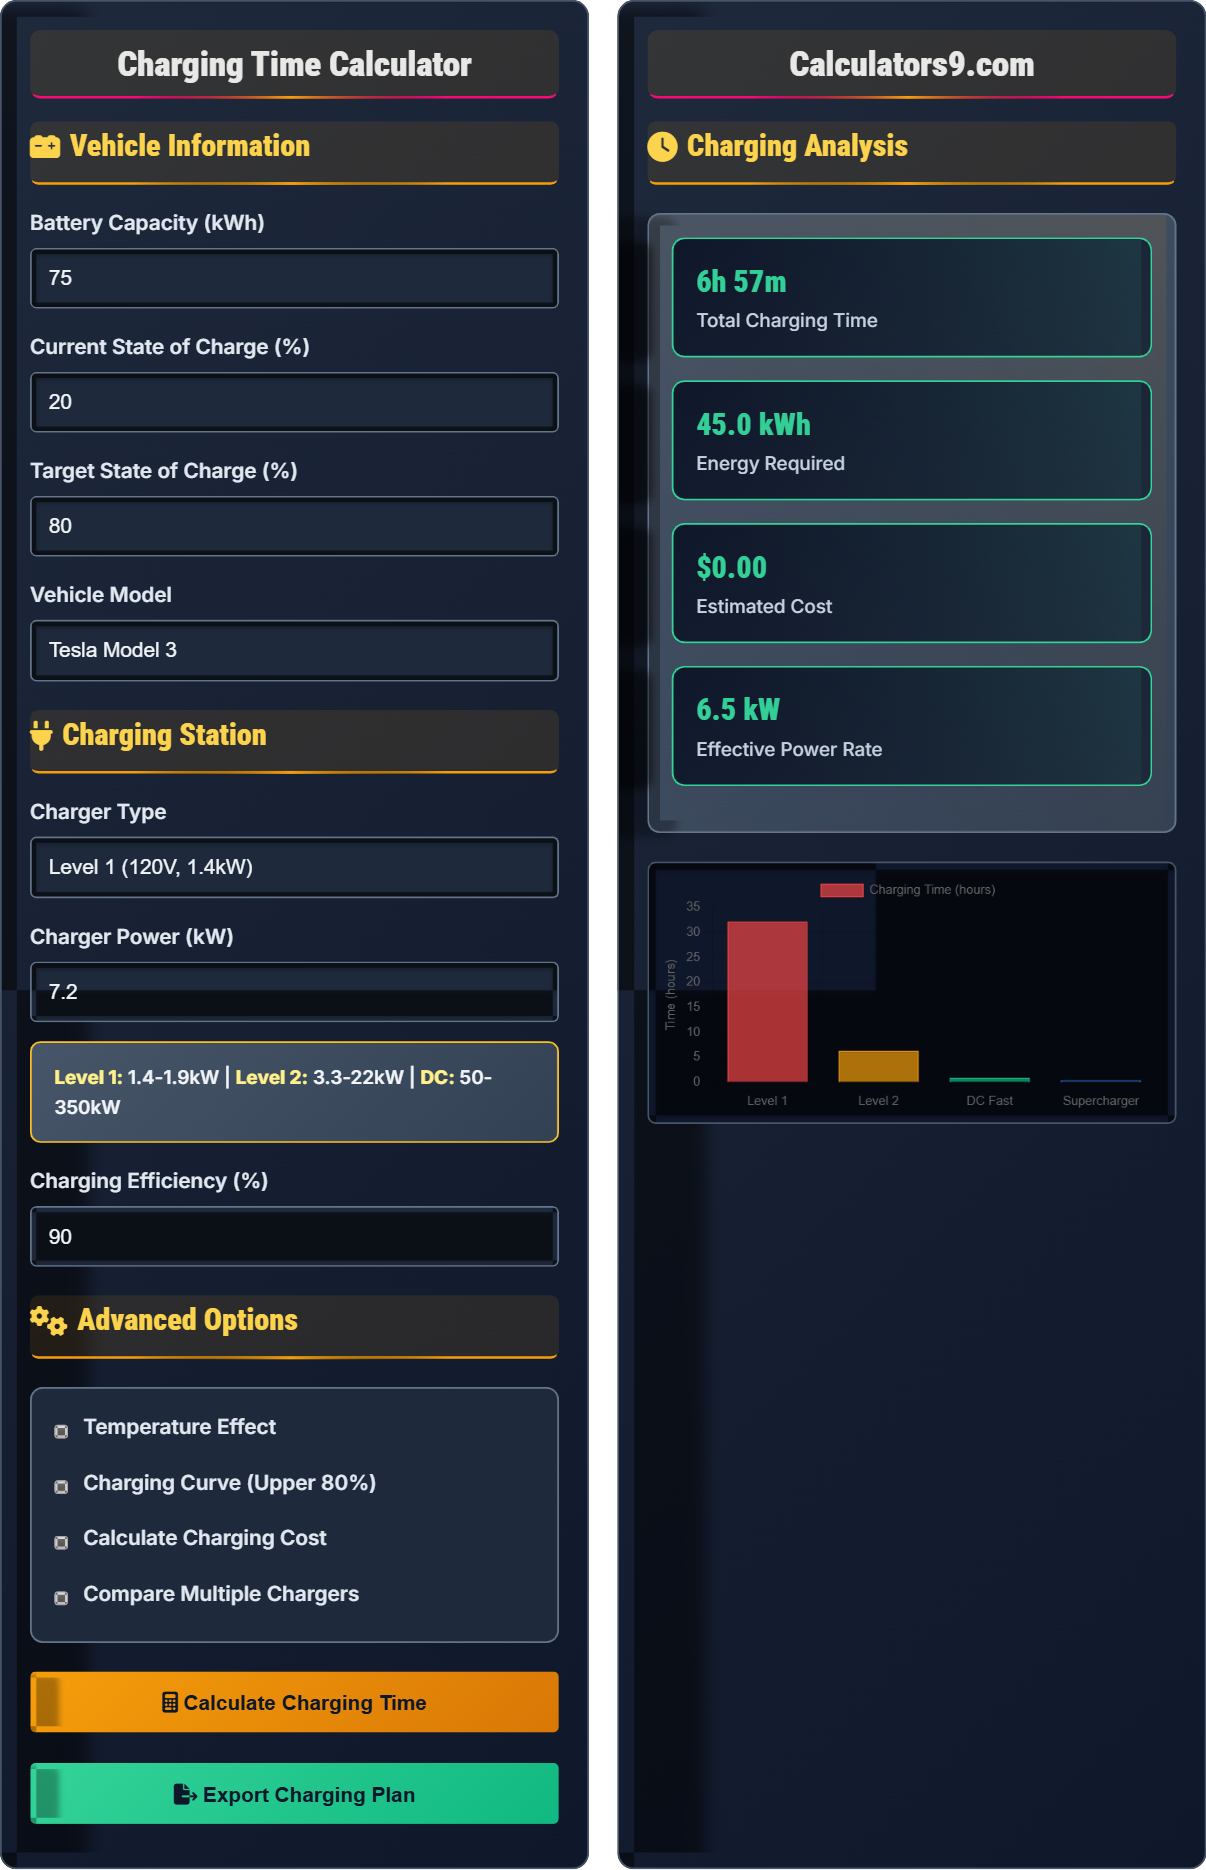
Charging Time Calculation:
Show CalculatorCharging time depends on several factors:
- Battery Capacity: Total kWh of the battery pack
- Charger Power: kW output of the charging station
- Starting SOC: Current state of charge
- Charging Efficiency: Typically 85-95%
Basic Formula:
Time (hours) = (Battery Capacity × (Target SOC - Current SOC)) / (Charger Power × Efficiency)
Example: For a 75 kWh battery from 20% to 80% on a 7.2 kW Level 2 charger:
Time = (75 × (0.8 - 0.2)) / (7.2 × 0.9) = 45 / 6.48 = 6.94 hours
Charging speeds: Level 1 (1.4-1.9 kW), Level 2 (3.3-22 kW), DC Fast (50-350 kW).
Vehicle Information
Charging Station
Advanced Options
Charging Analysis
| Phase | SoC Range | Time | Rate |
|---|---|---|---|
| Initial | 20% → 80% | 6h 56m | 7.2 kW |
| Slow Charging | 80% → 90% | 1h 23m | 4.8 kW |
| Trickle Charging | 90% → 100% | 2h 05m | 2.4 kW |
Charging Time Optimization Guide
Charging time is the duration required to charge an electric vehicle battery from a specific state of charge to a target state of charge. It depends on battery capacity, charger power, and efficiency. Understanding charging time helps plan trips and optimize charging schedules.
Effective charging time calculation considers:
- Charging Curve: Slower charging at higher SoC
- Temperature Effects: Cold weather reduces charging speed
- Charger Compatibility: Vehicle maximum charging rate
- Grid Conditions: Voltage stability and load
- Efficiency Losses: Heat and conversion losses
- 80% is optimal for daily charging
- DC fast charging is fastest but less efficient
- Cold weather increases charging time
- Charging slows significantly above 80%
Charging Time & Efficiency Quiz
How long does it take to charge a 60 kWh battery from 20% to 80% using a 7.2 kW Level 2 charger?
The answer is C) 5 hours. Using the formula: Time = (Battery Capacity × (Target SOC - Current SOC)) / Charger Power. Time = (60 × (0.8 - 0.2)) / 7.2 = (60 × 0.6) / 7.2 = 36 / 7.2 = 5 hours. This calculation assumes 100% efficiency.
The charging time formula is based on energy conservation. The energy needed (kWh) equals the battery capacity times the SOC difference. Dividing by the charger power (kW) gives the time in hours. In practice, efficiency is less than 100% due to heat losses and conversion inefficiencies.
State of Charge (SoC): Percentage of battery capacity
kWh: Kilowatt-hour, energy unit
kW: Kilowatt, power unit
• Time = Energy Needed / Power
• Energy = Battery Capacity × SOC Difference
• Account for efficiency losses
• Remember: Time = Energy / Power
• Convert percentages to decimals
• Add 10-15% for real-world efficiency
• Forgetting to convert percentages
• Not accounting for efficiency losses
• Confusing energy and power units
Calculate the actual charging time for a 75 kWh battery from 10% to 90% using a 22 kW charger with 92% efficiency. Show your work and explain the impact of efficiency on charging time.
Step 1: Calculate energy needed
Energy = 75 × (0.9 - 0.1) = 75 × 0.8 = 60 kWh
Step 2: Calculate effective charging power
Effective power = 22 × 0.92 = 20.24 kW
Step 3: Calculate charging time
Time = 60 / 20.24 = 2.96 hours ≈ 2 hours 58 minutes
Without efficiency correction: 60 / 22 = 2.73 hours (2h 44m)
Efficiency reduces the effective power by 8%, increasing time by 14 minutes.
Charging efficiency accounts for energy losses during the charging process. These losses occur due to heat generation in the battery and charging circuit, conversion inefficiencies in the onboard charger, and cable losses. The efficiency factor effectively reduces the usable power from the charger.
Charging Efficiency: Percentage of power reaching battery
Energy Losses: Power lost as heat
Effective Power: Actual power delivered to battery• Effective Power = Rated Power × Efficiency
• Efficiency typically 85-95%
• Higher temperatures reduce efficiency
• Always account for efficiency
• Efficiency decreases with temperature
• Higher charging rates may have lower efficiency
• Assuming 100% efficiency
• Not accounting for temperature effects
• Forgetting efficiency in time calculations
You need to charge your 80 kWh battery from 20% to 90% at a charging station. Compare the charging times for a 7.2 kW Level 2 charger versus a 50 kW DC fast charger. Which is more efficient for a 2-hour stop?
Step 1: Calculate energy needed
Energy = 80 × (0.9 - 0.2) = 80 × 0.7 = 56 kWh
Step 2: Level 2 charging time (with 90% efficiency)
Effective power = 7.2 × 0.9 = 6.48 kW
Time = 56 / 6.48 = 8.64 hours ≈ 8h 38m
Step 3: DC fast charging time (with 85% efficiency)
Effective power = 50 × 0.85 = 42.5 kW
Time = 56 / 42.5 = 1.32 hours ≈ 1h 19m
For a 2-hour stop, the DC fast charger is more efficient, allowing full charging within the time window.
Charging time scales inversely with power. A 7x power increase (50 kW vs 7.2 kW) results in roughly 1/7th the charging time, though efficiency factors modify this relationship. DC fast chargers are essential for long-distance travel where time constraints matter.
Level 2 Charger: 240V residential/specialty charging
DC Fast Charger: High-power public charging
Power Scaling: Relationship between power and time
• Charging time inversely proportional to power
• DC fast charging for time-sensitive needs
• Level 2 for overnight/scheduled charging
• Plan charging stops around 80% rule
• DC charging is best for long trips
• Level 2 is sufficient for daily use
• Not considering efficiency differences
• Assuming linear charging throughout
• Forgetting time constraints for travel
Why does charging slow down significantly above 80% SOC? If a battery charges at 22 kW from 20% to 80%, but only 5 kW from 80% to 90%, calculate the total time to charge from 20% to 90% for a 75 kWh battery.
Charging slows above 80% to protect battery life and safety. The battery management system reduces current to prevent overcharging and excessive heat generation.
Step 1: Energy from 20% to 80%
Energy = 75 × (0.8 - 0.2) = 45 kWh
Time = 45 / (22 × 0.9) = 45 / 19.8 = 2.27 hours
Step 2: Energy from 80% to 90%
Energy = 75 × (0.9 - 0.8) = 7.5 kWh
Time = 7.5 / (5 × 0.9) = 7.5 / 4.5 = 1.67 hours
Step 3: Total time = 2.27 + 1.67 = 3.94 hours ≈ 3h 56m
The final 10% takes 42% of the total time!
The charging curve reflects the battery's physical limitations. As SOC increases, the voltage differential between the charger and battery decreases, requiring more complex management. The battery's internal resistance also changes with SOC, affecting charging efficiency. This non-linear behavior is why 80% is often considered a practical target.
Charging Curve: Non-linear power vs SOC relationship
Battery Management System: Controls charging parameters
Internal Resistance: Opposition to current flow
• Charging power decreases above 80% SOC
• Final 20% takes disproportionate time
• 80% is optimal for most charging sessions
• Plan for slower charging at higher SOC
• 80% is sufficient for most needs
• Avoid frequent 100% charging
• Assuming constant charging rate
• Charging to 100% unnecessarily
• Not accounting for curve in planning
How does cold weather (0°C/32°F) affect charging time?
The answer is C) Increases time by 30-50%. Cold temperatures significantly increase charging time because battery ion mobility decreases, internal resistance increases, and the battery management system may reduce charging rates to prevent damage. Many EVs also warm the battery before charging, adding to the total time.
Battery chemistry is temperature-dependent. Cold temperatures reduce the mobility of lithium ions in the electrolyte, increasing internal resistance. This reduces the battery's ability to accept charge, forcing the system to reduce charging current. The battery may also need pre-heating before charging can begin safely.
Ion Mobility: Movement of charged particles
Internal Resistance: Opposition to current flow
Battery Pre-heating: Warming battery before charging
• Cold weather: 30-50% longer charging
• Battery may pre-heat before charging
• Charging rates reduce at low temperatures
• Pre-condition battery while driving
• Park in warmer locations when possible
• Allow extra time for charging in cold
• Not accounting for temperature effects
• Assuming same charging time year-round
• Forgetting battery pre-heating time
FAQ
Q: How accurate are charging time calculators compared to real-world charging?
A: Modern charging time calculators are typically 80-90% accurate when properly configured. For example:
For a 75 kWh battery charging from 20% to 80% on a 7.2 kW charger:
Theoretical time: (75 × 0.6) / 7.2 = 6.25 hours
With 90% efficiency: 6.25 / 0.9 = 6.94 hours
Real-world factors: -10% for temperature, -5% for aging
Adjusted time: 6.94 × 1.15 = 8.0 hours
Actual charging: 7.5-8.5 hours
The most significant variables are temperature, battery age, and charging curve effects above 80% SOC.
Q: What's the most cost-effective charging strategy?
A: Cost-effective charging strategies include:
- Off-peak hours: 50-70% cheaper electricity
- Home charging: Level 2, lowest rates
- Time-of-use plans: 2-7¢/kWh vs 15-25¢/kWh
- Workplace charging: Free electricity
- Membership programs: 20-40% discounts
For example, if home electricity is $0.10/kWh and public DC charging is $0.40/kWh, charging at home costs $7.50 for 75 kWh vs $30 at public stations. That's $22.50 saved per full charge!