Accounts Receivable Aging Calculator
Track outstanding invoices • 2026 best practices
AR Aging Analysis:
Show the calculator\( \text{Aging Bucket} = \text{Invoice Amount} \times \text{Days Outstanding} \)
Where:
- \( \text{Current} \) = 0-30 days past due
- \( \text{30-60 Days} \) = 31-60 days past due
- \( \text{60-90 Days} \) = 61-90 days past due
- \( \text{Over 90 Days} \) = More than 90 days past due
Accounts receivable aging reports categorize outstanding customer invoices by age to assess collection risk. Current receivables (0-30 days) are typically collectible, while older receivables become increasingly difficult to collect. Best practices recommend following up on 30+ day receivables immediately.
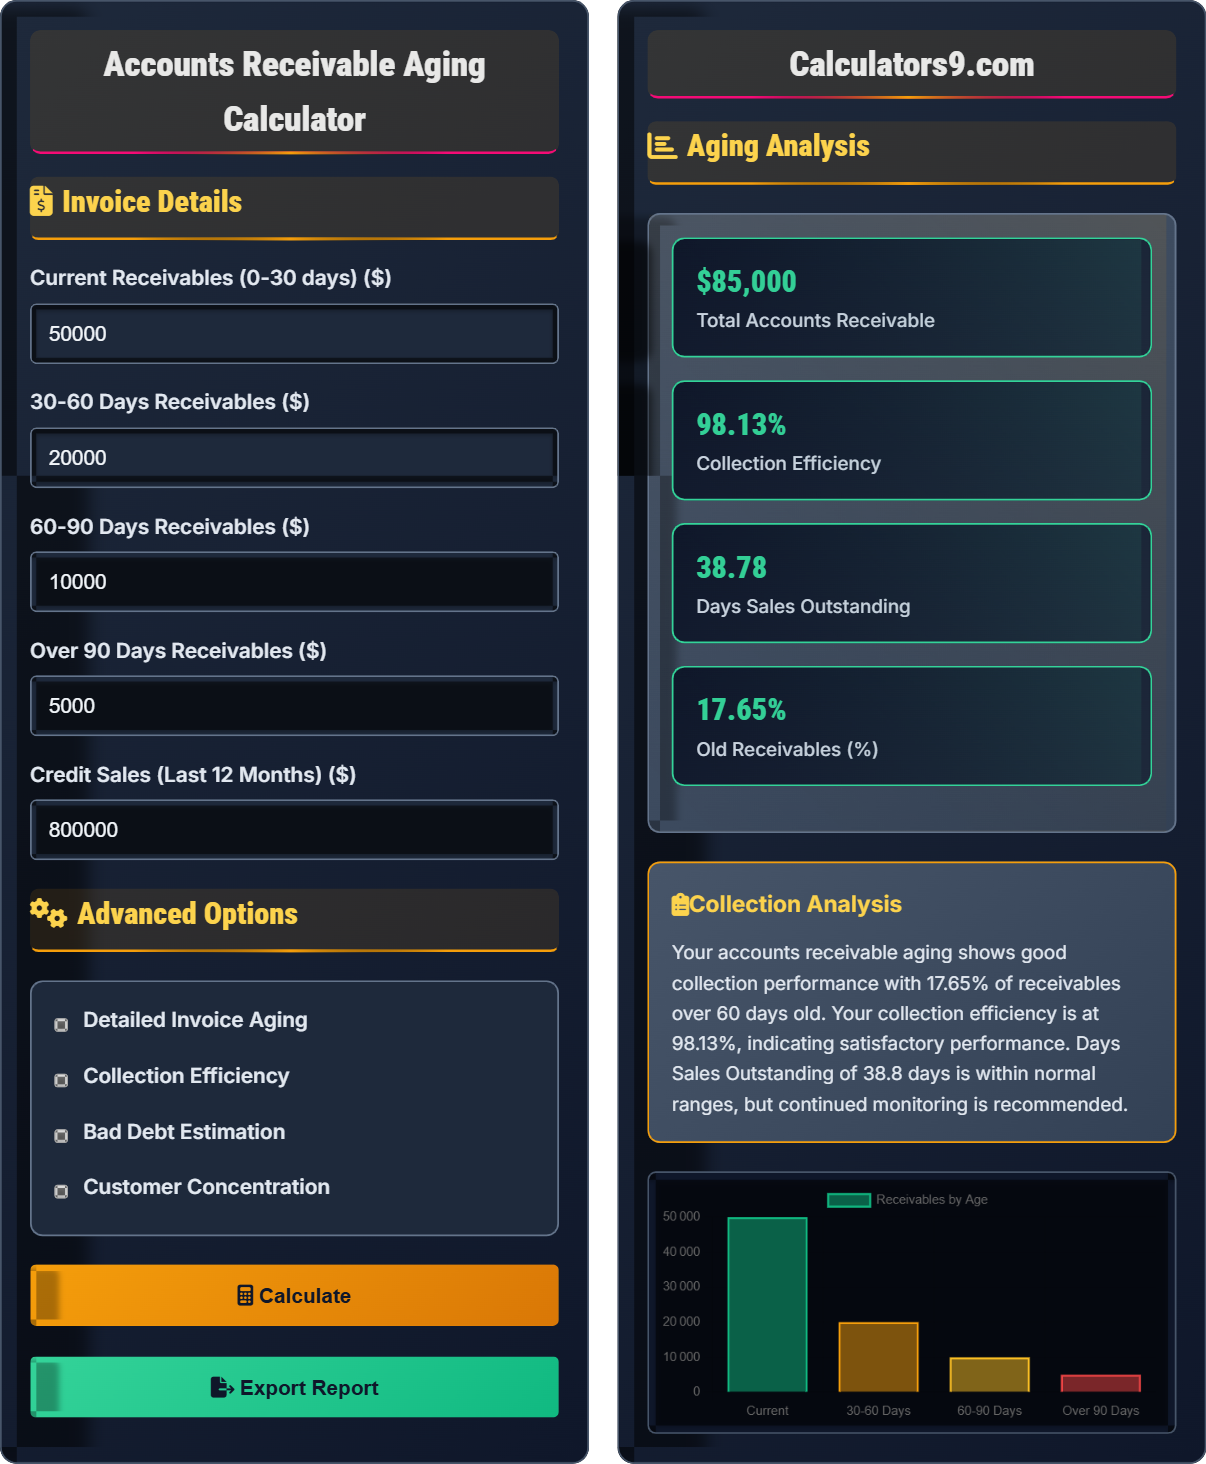
Example: For a company with $50,000 in current receivables, $20,000 in 30-60 day receivables, $10,000 in 60-90 day receivables, and $5,000 in over 90 day receivables:
Total AR = $50,000 + $20,000 + $10,000 + $5,000 = $85,000
Percentage of old receivables = ($10,000 + $5,000) ÷ $85,000 = 17.6%, indicating potential collection issues.
Invoice Details
Advanced Options
Aging Analysis
| Age Group | Amount | % of Total | Collection Priority |
|---|
| Category | Value | Target | Status |
|---|
Comprehensive AR Aging Guide
Accounts receivable aging is a report that categorizes outstanding customer invoices by their age to assess collection risk. The report groups receivables into time buckets (typically 0-30, 31-60, 61-90, and over 90 days) to identify which invoices are overdue and by how much. This analysis helps businesses prioritize collection efforts and estimate potential bad debts.
Standard aging categories and their significance:
30-60 days: Requires follow-up
60-90 days: High collection risk
Over 90 days: Likely uncollectible
These categories help businesses assess the health of their receivables portfolio and take appropriate collection actions.
Important AR metrics to monitor:
- Days Sales Outstanding (DSO): Average days to collect receivables
- Collection Effectiveness: Percentage of receivables collected during period
- Bad Debt Percentage: Uncollectible receivables as % of total sales
- Concentration Risk: Percentage owed by top customers
- Generate aging reports monthly to track trends
- Follow up consistently with overdue customers
- Implement automated reminders for approaching due dates
- Review credit policies quarterly to minimize risk
- Set aside adequate reserves for potential bad debts
AR Aging Basics
Report categorizing receivables by age to assess collection risk.
Current (0-30), 30-60, 60-90, Over 90 days.
Used to prioritize collection efforts and estimate bad debts.
- Monitor aging weekly
- Follow up on 30+ day receivables
- Reserve for over 90 day receivables
Collection Strategies
Focus on oldest receivables first, then largest amounts.
- Implement systematic follow-up
- Offer early payment discounts
- Enforce credit limits
- Review customer creditworthiness
- Balance collection with customer relationships
- Consider economic conditions
- Document all collection efforts
- Establish clear escalation procedures
AR Aging Learning Quiz
Which aging bucket typically indicates the highest collection risk?
The answer is D) Over 90 days. As receivables age, the likelihood of collection decreases significantly. Receivables over 90 days old are considered to have the highest collection risk and are often written off as bad debt. The collection probability drops dramatically after 90 days, making these the most critical to address.
Students should understand that aging categories represent increasing risk levels. The older a receivable becomes, the less likely it is to be collected. This concept is fundamental to credit management and financial analysis. The 90+ day category typically has collection success rates below 25%, making it the highest priority for write-offs.
Collection Risk: The probability that an outstanding receivable will not be collected
Bad Debt: Receivables that are deemed uncollectible and written off
Collection Probability: The likelihood that an aged receivable will be collected
• Collection probability decreases with age
• 90+ day receivables often require write-offs
• Follow up on 30+ day receivables immediately
• Focus collection efforts on oldest receivables first
• Set automatic alerts for aging thresholds
• Maintain detailed collection records
• Ignoring receivables until they're very old
• Not following up consistently
• Delaying write-offs for fear of impacting earnings
A company has $40,000 in current receivables, $25,000 in 30-60 day receivables, $15,000 in 60-90 day receivables, and $10,000 in over 90 day receivables. What percentage of total receivables are considered high risk (60+ days)? Show your work.
Step 1: Calculate total receivables
Total = $40,000 + $25,000 + $15,000 + $10,000 = $90,000
Step 2: Calculate high-risk receivables (60+ days)
High-risk = $15,000 + $10,000 = $25,000
Step 3: Calculate percentage
Percentage = ($25,000 ÷ $90,000) × 100 = 27.78%
Therefore, 27.78% of the company's receivables are considered high risk.
This calculation helps assess the overall health of a company's receivables portfolio. A high percentage of old receivables indicates potential cash flow problems and increased bad debt risk. Generally, anything above 20% in the 60+ day category is considered concerning and warrants management attention.
High-Risk Receivables: Amounts overdue 60+ days that have reduced collection probability
Receivables Portfolio: The total collection of outstanding customer invoices
Collection Probability: The estimated chance of collecting an aged receivable
• Calculate percentages to assess portfolio health
• 20%+ in 60+ days is concerning
• Monitor trends over time
• Calculate aging percentages monthly
• Compare to industry benchmarks
• Watch for increasing trends in old receivables
• Only looking at total receivables without aging
• Not calculating percentages for trend analysis
• Failing to identify problematic customers
Company XYZ has total accounts receivable of $120,000 and annual credit sales of $960,000. What is their Days Sales Outstanding (DSO)? If the industry average is 45 days, how does this company perform?
Step 1: Calculate Days Sales Outstanding (DSO)
DSO = (Total Receivables ÷ Annual Credit Sales) × 365
DSO = ($120,000 ÷ $960,000) × 365 = 0.125 × 365 = 45.625 days
Step 2: Compare to industry benchmark
The company's DSO of 45.6 days is slightly above the industry average of 45 days. This indicates that Company XYZ takes slightly longer than average to collect its receivables, suggesting a minor opportunity for improvement in collection processes.
DSO is a critical metric that measures the average number of days it takes a company to collect payment after a sale. A higher DSO means slower collections and potential cash flow issues. The formula converts the receivables-to-sales ratio into a time period, making it easier to understand and compare across companies.
Days Sales Outstanding (DSO): Average number of days to collect receivables
Cash Conversion Cycle: Time from purchasing inventory to collecting payment
Collection Efficiency: How quickly receivables are converted to cash
• DSO = (Receivables ÷ Credit Sales) × 365
• Lower DSO indicates better performance
• Compare to industry benchmarks
• Calculate DSO monthly for trend tracking
• Break down by customer segment
• Use to set collection targets
• Using total sales instead of credit sales
• Forgetting to multiply by 365
• Not comparing to industry averages
A company has identified that 35% of their receivables are over 60 days old, significantly higher than the industry average of 15%. Their total receivables are $200,000. What collection strategies should they implement, and what is the potential impact of improving their collection process?
Current Situation:
Over 60 day receivables = $200,000 × 35% = $70,000
Industry average = $200,000 × 15% = $30,000
Excess old receivables = $70,000 - $30,000 = $40,000
Recommended strategies:
- Implement stricter credit approval processes
- Establish formal collection procedures with defined timelines
- Provide collection training to staff
- Offer early payment discounts
- Set up automated dunning system
- Review customer credit limits quarterly
Potential impact: Improving from 35% to 20% would reduce old receivables by $30,000, improving cash flow and reducing bad debt risk.
This problem demonstrates how AR aging analysis can reveal operational issues and guide strategic improvements. The 35% figure is significantly above the 15% benchmark, indicating systemic problems in credit management. Addressing these issues can have substantial positive impacts on cash flow and financial performance.
Dunning: Process of sending reminder notices for overdue payments
Credit Approval: Evaluation process to determine customer creditworthiness
Collection Procedures: Systematic steps to recover overdue receivables
• Examine root causes of collection problems
• Implement systematic solutions
• Monitor improvement progress
• Start with highest-value customers
• Document all collection activities
• Review aging reports weekly
• Reactive rather than proactive collection
• Inconsistent collection follow-up
Based on historical data, which aging category typically requires the highest bad debt reserve percentage?
The answer is D) Over 90 days. Historical data consistently shows that receivables over 90 days old have the lowest collection probability, often below 25%. Companies typically reserve 50-100% of amounts in this category as bad debt, compared to 0-5% for current receivables.
Students must understand the relationship between aging and bad debt provisioning. The allowance method requires companies to estimate uncollectible amounts based on historical experience. The older a receivable becomes, the higher the reserve percentage should be, reflecting the decreasing probability of collection.
Bad Debt Reserve: Estimated amount of receivables that will not be collected
Allowance Method: Accounting method for estimating uncollectible receivables
Collection Probability: Estimated chance of collecting an aged receivable
• Higher aging = Higher reserve percentage
• Over 90 days often requires 50-100% reserves
• Reserves should reflect historical collection patterns
• Analyze historical collection data
• Adjust reserves based on economic conditions
• Review reserves monthly
• Underestimating bad debt reserves
• Not adjusting for economic changes
• Failing to write off confirmed bad debts
FAQ
Q: How often should I generate AR aging reports?
A: AR aging reports should be generated at least monthly, but ideally weekly for businesses with significant receivables. Weekly reports allow for proactive collection management before receivables become seriously overdue.
For example, if you generate reports monthly, a customer who pays on day 35 won't appear as overdue until the following month's report. Weekly reports catch these situations much earlier, allowing for timely intervention.
The frequency should align with your collection policy and business cycle, but never exceed monthly reporting for effective credit management.
Q: What percentage of receivables in the 60+ day bucket is concerning?
A: Any percentage over 20% in the 60+ day bucket is generally concerning. The ideal target is under 10% in this category.
Mathematically, if your total receivables are \( R \), and your 60+ day receivables are \( O \), then the percentage is:
\( \text{Percentage} = \left(\frac{O}{R}\right) \times 100 \)
For example, if you have \( \$100{,}000 \) in total receivables and \( \$25{,}000 \) in 60+ day receivables:
\( \text{Percentage} = \left(\frac{25{,}000}{100{,}000}\right) \times 100 = 25\% \)
This 25% is above the 20% threshold and indicates a need for improved collection processes.