Break-Even Analyzer
Calculate your business break-even point • 2026 edition
Break-Even Formula:
Show the analyzer\( \text{Break-Even Units} = \frac{\text{Fixed Costs}}{\text{Selling Price} - \text{Variable Cost per Unit}} \)
\( \text{Break-Even Revenue} = \text{Break-Even Units} \times \text{Selling Price} \)
\( \text{Contribution Margin} = \text{Selling Price} - \text{Variable Cost per Unit} \)
Where:
- \( \text{Fixed Costs} = \text{Costs that don't change with production volume} \)
- \( \text{Variable Cost per Unit} = \text{Costs that change with each unit produced} \)
- \( \text{Contribution Margin} = \text{Amount each unit contributes to covering fixed costs} \)
- \( \text{Break-Even Point} = \text{Sales level where total revenue equals total costs} \)
This formula calculates the number of units that must be sold to cover all costs. It's essential for pricing decisions, cost management, and profitability analysis.
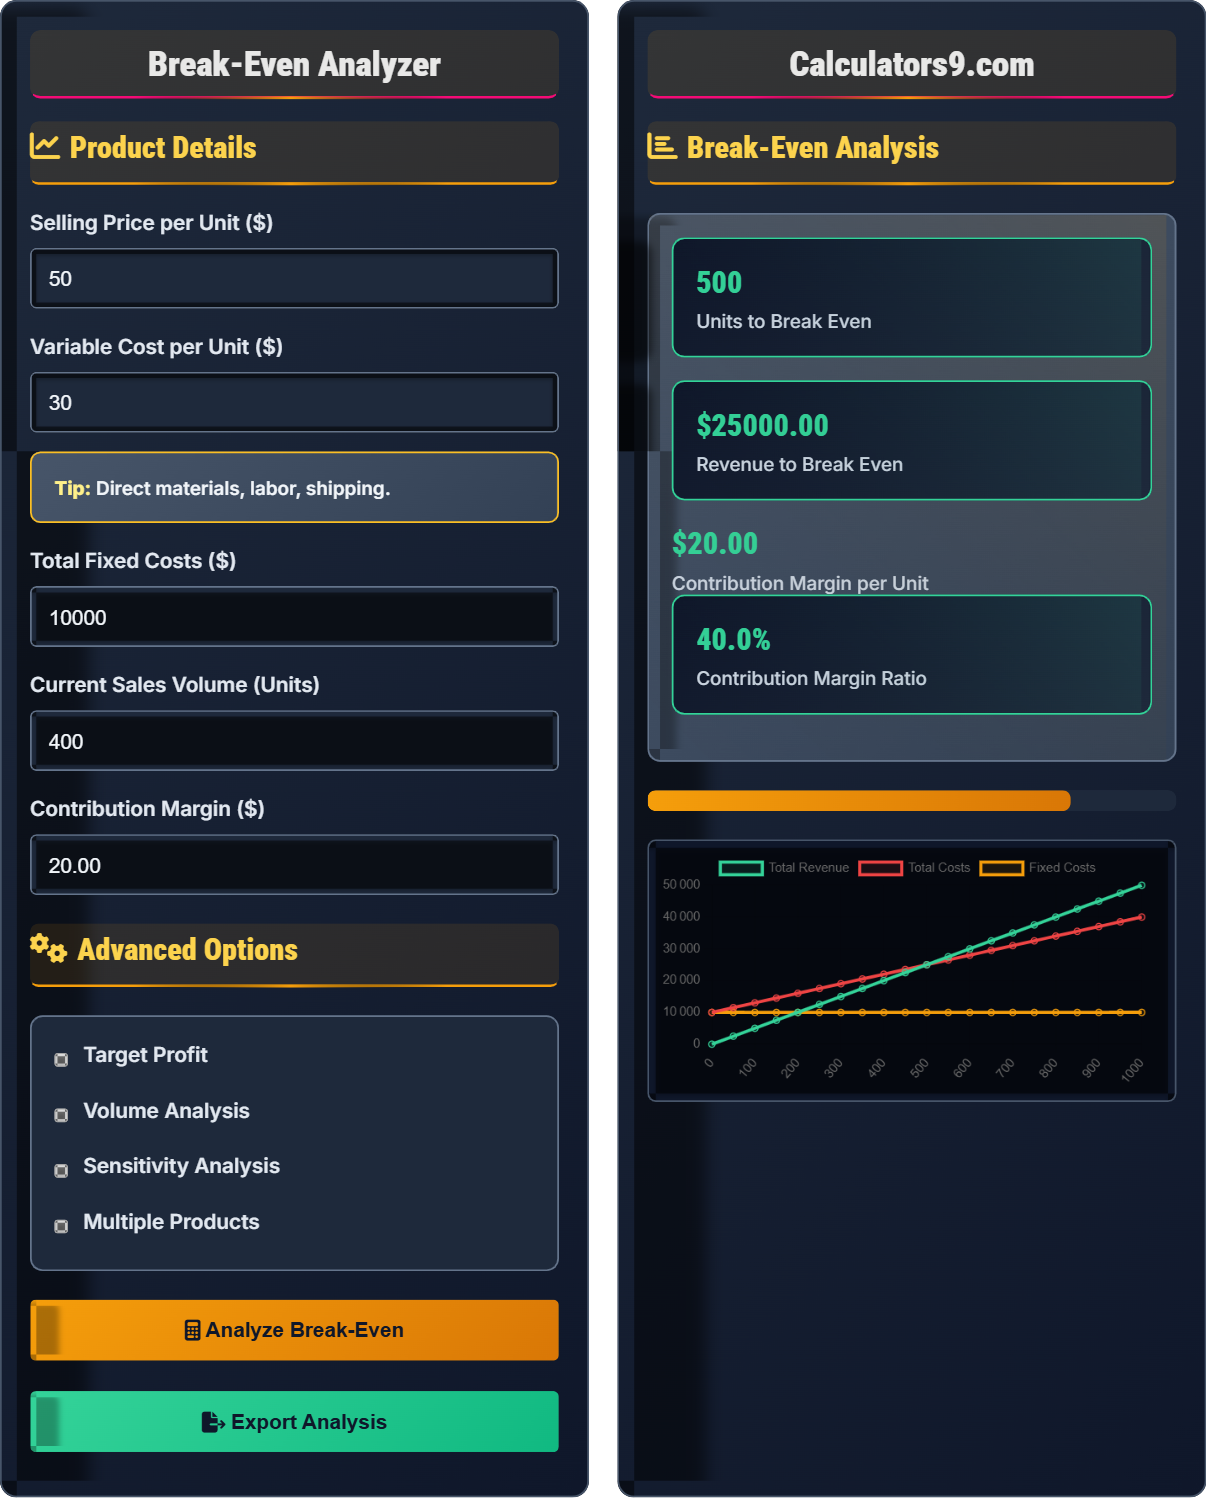
Example: For a product with $50 selling price, $30 variable cost, and $10,000 fixed costs:
Contribution Margin: $50 - $30 = $20 per unit
Break-Even Units: $10,000 ÷ $20 = 500 units
Break-Even Revenue: 500 × $50 = $25,000
Therefore, you need to sell 500 units for $25,000 in revenue to break even.
Product Details
Advanced Options
Break-Even Analysis
| Metric | Value | Impact |
|---|
Sensitivity Analysis
Comprehensive Break-Even Analysis Guide
Break-even analysis is a financial calculation that determines the point at which total revenues equal total costs. It helps businesses understand the minimum sales volume needed to avoid losses and provides insights into pricing, cost management, and profitability.
The standard break-even analysis uses the following formula:
Where:
- \( \text{Fixed Costs} = \text{Costs that remain constant regardless of production volume} \)
- \( \text{Variable Cost per Unit} = \text{Costs that change proportionally with production} \)
- \( \text{Contribution Margin} = \text{Selling Price} - \text{Variable Cost per Unit} \)
- \( \text{Break-Even Revenue} = \text{Break-Even Units} \times \text{Selling Price} \)
Break-even analysis has several key applications:
- Pricing Decisions: Determine optimal selling prices for profitability
- Cost Control: Identify areas to reduce variable or fixed costs
- Production Planning: Establish minimum production targets
- Investment Evaluation: Assess feasibility of new ventures
- Performance Monitoring: Track progress toward profitability
- Lower Fixed Costs: Reduce overhead to decrease break-even point
- Increase Selling Price: Higher margins reduce units needed
- Reduce Variable Costs: Improve efficiency to increase contribution margin
- Volume Discounts: Negotiate better rates for bulk purchases
- Regular Reviews: Update calculations as costs change
Break-Even Basics
Determining the sales level where total revenue equals total costs.
\( \text{Break-Even Units} = \frac{\text{Fixed Costs}}{\text{Selling Price} - \text{Variable Cost per Unit}} \)
Where units = fixed costs ÷ contribution margin.
- Fixed costs remain constant
- Variable costs change with volume
- Contribution margin drives profitability
Analysis Strategies
Amount each unit contributes to covering fixed costs.
- Reduce fixed costs where possible
- Increase selling price strategically
- Lower variable costs per unit
- Improve operational efficiency
- Market demand affects pricing
- Quality may impact cost reduction
- Fixed costs may have minimums
- Competition affects pricing power
Break-Even Analysis Learning Quiz
Which of the following is classified as a FIXED cost?
The answer is B) Rent for factory space. Fixed costs remain constant regardless of production volume. Rent is paid whether you produce 10 units or 10,000 units. Raw materials, packaging, and piece-rate wages all increase with production volume, making them variable costs.
Understanding the difference between fixed and variable costs is crucial for break-even analysis. Fixed costs don't change with production levels (within a relevant range), while variable costs change proportionally with output. This distinction affects how costs behave and how they impact the break-even point.
Fixed Cost: Cost that remains constant regardless of production volume
Variable Cost: Cost that changes proportionally with production volume
Relevant Range: Activity level where cost behavior remains consistent
• Fixed costs per unit decrease as volume increases
• Variable costs per unit typically remain constant
• Total costs = Fixed costs + (Variable cost per unit × Units)
• Fixed = "Forever Constant"
• Variable costs fluctuate with business activity
• High fixed costs require higher volumes to achieve profitability
• Confusing fixed costs with variable costs in calculations
• Forgetting that fixed costs per unit decrease with higher volume
• Not accounting for all variable costs in pricing decisions
Calculate the break-even point in units for a product with a selling price of $75, variable cost of $45 per unit, and fixed costs of $15,000. Show your work.
Step 1: Calculate contribution margin per unit = Selling price - Variable cost
Contribution Margin = $75 - $45 = $30 per unit
Step 2: Calculate break-even units = Fixed costs ÷ Contribution margin per unit
Break-Even Units = $15,000 ÷ $30 = 500 units
Step 3: Calculate break-even revenue = Break-even units × Selling price
Break-Even Revenue = 500 × $75 = $37,500
Therefore, the company must sell 500 units to break even, generating $37,500 in revenue.
This calculation demonstrates the core break-even formula. The contribution margin represents how much each sale contributes to covering fixed costs. Once fixed costs are covered, additional sales become pure profit. The higher the contribution margin, the fewer units needed to break even.
Break-Even Point: Sales volume where total revenue equals total costs
Contribution Margin: Revenue per unit minus variable cost per unit
Fixed Costs: Costs that don't change with sales volume
• Break-even = Fixed costs ÷ Contribution margin per unit
• Contribution margin = Price per unit - Variable cost per unit
• Sales above break-even generate profit
• Higher contribution margins mean lower break-even points
• Reduce fixed costs to lower break-even requirements
• Focus on products with higher contribution margins
• Including taxes in break-even calculations (they occur after break-even)
• Confusing variable costs with fixed costs
• Forgetting to verify the calculation with actual revenue and expenses
A company sells widgets for $100 each with variable costs of $60 per widget. Their fixed costs are $20,000 per month. How many widgets must they sell to achieve a profit of $10,000 per month?
Step 1: Calculate contribution margin per unit = $100 - $60 = $40
Step 2: For profit target, use formula: Units = (Fixed Costs + Target Profit) ÷ Contribution Margin
Step 3: Units = ($20,000 + $10,000) ÷ $40
Step 4: Units = $30,000 ÷ $40 = 750 units
Step 5: Verify: Revenue (750 × $100) = $75,000
Variable costs (750 × $60) = $45,000
Fixed costs = $20,000
Profit = $75,000 - $45,000 - $20,000 = $10,000
Therefore, the company must sell 750 widgets to achieve a $10,000 monthly profit.
This problem extends the basic break-even formula to include a profit target. Instead of just covering fixed costs, the company needs to generate enough contribution margin to cover both fixed costs and the desired profit. This is achieved by adding the target profit to the fixed costs in the numerator.
Target Profit: Desired profit amount to be achieved
Contribution Approach: Using contribution margin for calculations
Profit Planning: Determining sales needed for desired profits
• For profit: Units = (Fixed costs + Target profit) ÷ Contribution margin
• Break-even ignores profit target
• Higher profit targets require more sales
• Add target profit to fixed costs in numerator
• Verify calculations with actual numbers
• Consider market demand for target sales
• Forgetting to add target profit to fixed costs
• Using break-even formula instead of profit formula
• Not verifying calculations with actual numbers
A manufacturer sells 1,000 units monthly at $50 per unit with variable costs of $30. Fixed costs are $15,000 per month. If they raise the price to $55 per unit, expecting a 10% decrease in sales volume, how will this affect their break-even point and monthly profit?
Current situation:
Contribution margin: $50 - $30 = $20 per unit
Break-even units: $15,000 ÷ $20 = 750 units
Current profit: (1,000 × $20) - $15,000 = $5,000
New situation:
New price: $55
New volume: 1,000 × 0.9 = 900 units
New contribution margin: $55 - $30 = $25 per unit
New break-even units: $15,000 ÷ $25 = 600 units
New profit: (900 × $25) - $15,000 = $7,500
Impact:
Break-even point decreases from 750 to 600 units
Monthly profit increases from $5,000 to $7,500
Therefore, the price increase results in a lower break-even point and higher profit despite lower sales volume.
This demonstrates the non-linear relationship between price, volume, and profit. When demand is inelastic (customers willing to pay more), increasing prices can boost profits even if volume decreases. The higher contribution margin per unit compensates for the reduced sales volume, resulting in improved profitability.
Price Elasticity: How sensitive demand is to price changes
Contribution Margin Ratio: Contribution margin as percentage of sales
Volume-Price Trade-off: Relationship between price changes and sales volume
• Higher prices don't always mean higher profits
• Consider customer price sensitivity when pricing
• Volume and price changes compound their effect on profit
• Test price changes on a small scale first
• Monitor competitor pricing regularly
• Consider value-based pricing over cost-plus pricing
• Assuming higher prices always lead to higher profits
• Not considering the impact of volume changes on fixed cost allocation
• Forgetting to factor in taxes when comparing profit scenarios
Which of the following would DECREASE the break-even point?
The answer is D) Increase in selling price. Looking at the break-even formula: BE Units = Fixed Costs ÷ (Selling Price - Variable Cost), an increase in selling price increases the denominator (contribution margin), which decreases the number of units needed to break even. All other options would increase the break-even point.
This question tests understanding of how different factors affect the break-even point. The break-even formula shows that anything that increases the contribution margin (selling price - variable cost) will decrease the break-even point. Conversely, anything that increases fixed costs or decreases the contribution margin will increase the break-even point.
Break-Even Sensitivity: How factors affect break-even point
Contribution Margin Impact: Effect on break-even units
Cost-Volume-Profit Analysis: Study of cost relationships
• Higher contribution margin = lower break-even point
• Higher fixed costs = higher break-even point
• Higher variable costs = higher break-even point
• Focus on increasing contribution margin
• Reduce fixed costs when possible
• Monitor variable cost ratios
• Not understanding how factors affect the formula components
• Confusing direction of impact
• Forgetting that contribution margin is the denominator
FAQ
Q: How do I determine if my business has reached the break-even point?
A: Your business reaches break-even when:
\( \text{Total Revenue} = \text{Total Fixed Costs} + \text{Total Variable Costs} \)
Or equivalently:
\( \text{Total Revenue} - \text{Total Variable Costs} = \text{Fixed Costs} \)
At break-even, your contribution margin (revenue minus variable costs) exactly covers your fixed costs, resulting in zero profit.
For example, if your fixed costs are $10,000 per month and your contribution margin is $20 per unit, you break even at 500 units sold. After selling 500 units, each additional unit sold generates pure profit of $20 per unit.
Track your sales volume and compare it to your calculated break-even point to determine if you've reached it.
Q: What's the difference between break-even analysis and cost-volume-profit (CVP) analysis?
A: Break-even analysis is a subset of CVP analysis:
Break-Even Analysis:
- Focused specifically on the point where revenue equals total costs
- Determines the minimum sales volume needed to avoid losses
- Calculates the break-even point in units and dollars
- Primarily concerned with the zero-profit threshold
Cost-Volume-Profit (CVP) Analysis:
- Broader analysis examining relationships between costs, volume, and profit
- Includes break-even analysis but also analyzes profit at various volumes
- Examines sensitivity of profit to changes in selling price, costs, and volume
- Used for strategic planning and decision-making
Break-even analysis answers "When do I start making profit?" while CVP analysis answers "How much profit will I make at different volume levels?"