Cash Burn Rate Calculator
Calculate your cash runway & flow • 2026 edition
Cash Burn Rate Formula:
Show the calculator\( \text{Cash Burn Rate} = \frac{\text{Cash Outflows} - \text{Cash Inflows}}{\text{Time Period}} \)
\( \text{Runway} = \frac{\text{Current Cash}}{\text{Monthly Burn Rate}} \)
\( \text{Monthly Burn Rate} = \frac{\text{Opening Cash} - \text{Closing Cash}}{\text{Months}} \)
Where:
- \( \text{Cash Outflows} = \text{Operating expenses, salaries, rent, etc.} \)
- \( \text{Cash Inflows} = \text{Revenue, investments, loans, etc.} \)
- \( \text{Runway} = \text{Months until cash is depleted} \)
- \( \text{Monthly Burn Rate} = \text{Cash used per month} \)
This formula calculates how quickly a business depletes its cash reserves. It's essential for startups and growing companies to monitor burn rate to ensure adequate runway for operations.
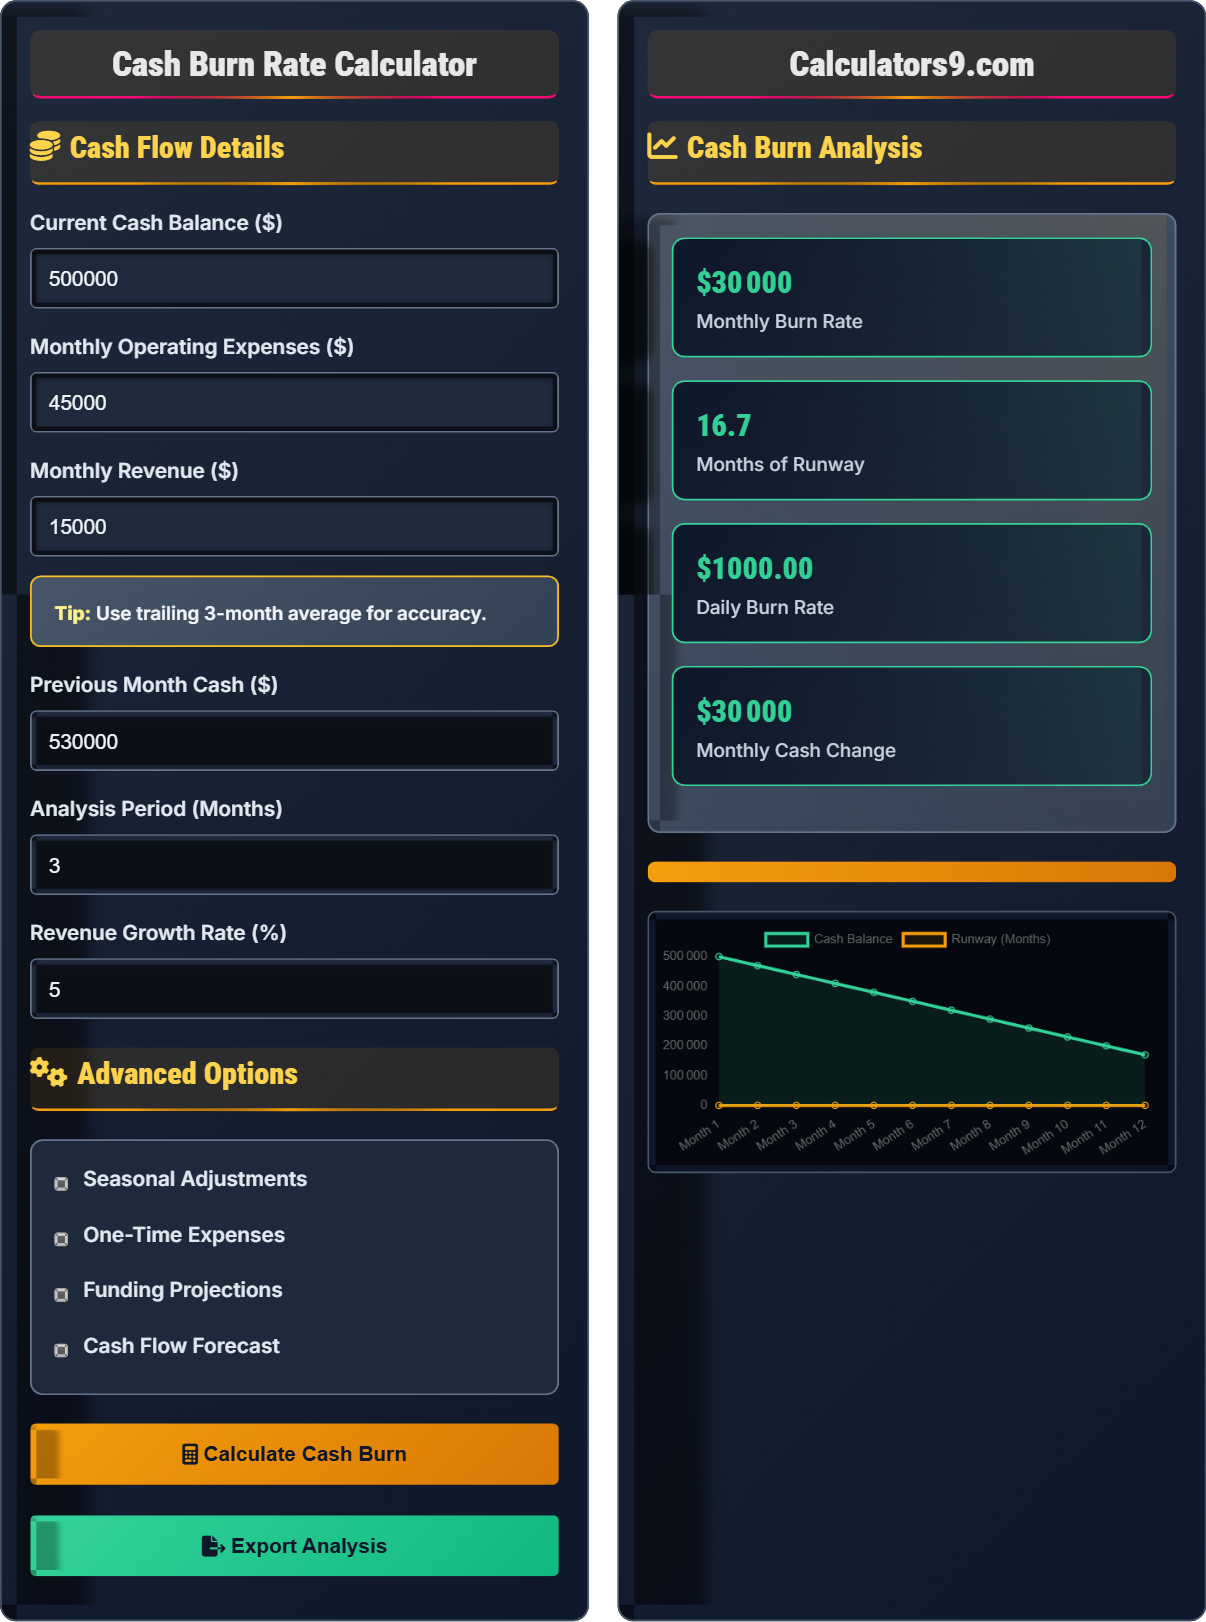
Example: If a company has $500,000 cash and burns $50,000 monthly:
Monthly Burn Rate: $50,000
Runway: $500,000 ÷ $50,000 = 10 months
At this rate, the company has 10 months of runway remaining.
Cash Flow Details
Advanced Options
Cash Burn Analysis
| Category | Amount | Percentage | Impact |
|---|
Scenario Analysis
Comprehensive Cash Burn Rate Guide
Cash burn rate measures how quickly a company uses its cash reserves. It's calculated as the difference between cash outflows and inflows over a specific period. This metric is crucial for startups and growing companies to understand their financial runway and sustainability.
The standard cash burn rate calculation uses the following formulas:
Where:
- \( \text{Cash Outflows} = \text{Operating expenses, salaries, rent, equipment, etc.} \)
- \( \text{Cash Inflows} = \text{Revenue, investments, loans, grants, etc.} \)
- \( \text{Runway} = \text{Months remaining before cash depletion} \)
- \( \text{Monthly Burn Rate} = \text{Net cash used per month} \)
Cash burn rate has several important implications for business management:
- Funding Timeline: Determines when additional funding is needed
- Cost Management: Identifies areas to reduce expenses
- Revenue Growth: Highlights need for accelerated sales efforts
- Operational Efficiency: Measures how effectively cash is being used
- Investor Relations: Critical metric for investor communications
- Monitor Weekly: Track burn rate weekly, not just monthly
- Reduce Burn Rate: Cut non-essential expenses and negotiate better terms
- Accelerate Revenue: Focus on faster customer acquisition and retention
- Manage Accounts Receivable: Collect payments faster to improve cash flow
- Plan Ahead: Maintain 12+ months of runway when possible
Cash Burn Basics
Measurement of how quickly a company uses its cash reserves.
\( \text{Cash Burn Rate} = \frac{\text{Cash Outflows} - \text{Cash Inflows}}{\text{Time Period}} \)
Where rate = net cash used per time period.
- Monitor regularly for early warning signs
- Runway should exceed funding timeline
- Reduce burn rate when possible
Management Strategies
Time remaining before cash reserves are depleted.
- Reduce operating expenses
- Accelerate revenue generation
- Improve collection efficiency
- Renegotiate payment terms
- Seasonal variations affect burn rate
- One-time expenses impact calculations
- Revenue growth can reduce burn rate
- Market conditions affect projections
Cash Burn Rate Learning Quiz
What does a negative cash burn rate indicate?
The answer is C) The company is generating more cash than it's spending. A negative burn rate occurs when cash inflows exceed cash outflows, meaning the company is actually generating cash rather than burning it. This is often called "positive cash flow" or being "cash flow positive."
Understanding the sign convention is crucial. In cash burn analysis, a positive number indicates cash is being consumed (burned), while a negative number indicates cash is being generated. This is counterintuitive to profit calculations where positive is good. For burn rate, negative values represent positive business performance.
Cash Burn Rate: Net cash consumed per time period
Positive Burn Rate: Cash is being depleted
Negative Burn Rate: Cash is being generated
• Positive burn rate = cash consumption
• Negative burn rate = cash generation
• Zero burn rate = break-even cash flow
• Think of it as "net cash change"
• Positive = getting smaller (burning)
• Negative = getting larger (generating)
• Confusing positive/negative interpretation
• Thinking positive is always good
• Not understanding the subtraction order
Calculate the monthly cash burn rate for a company with $120,000 in monthly expenses and $80,000 in monthly revenue. Show your work.
Step 1: Identify cash outflows (expenses) = $120,000
Step 2: Identify cash inflows (revenue) = $80,000
Step 3: Calculate net cash flow = Cash Inflows - Cash Outflows
Net Cash Flow = $80,000 - $120,000 = -$40,000
Step 4: Monthly Burn Rate = Absolute value of net cash flow = $40,000
Therefore, the company has a monthly burn rate of $40,000, meaning it consumes $40,000 of cash each month.
This calculation demonstrates the basic formula: Cash Burn Rate = Cash Outflows - Cash Inflows. The company is spending $40,000 more than it's earning each month, which depletes its cash reserves. This negative cash flow situation is common for startups and growing companies that are investing heavily to scale their business.
Cash Outflows: Money going out of the business
Cash Inflows: Money coming into the business
Net Cash Flow: Difference between inflows and outflows
• Burn Rate = Outflows - Inflows
• Higher expenses increase burn rate
• Higher revenue decreases burn rate
• Track burn rate weekly for early detection
• Compare to previous periods for trends
• Consider seasonality in calculations
• Using wrong order of subtraction
• Forgetting to account for all cash flows
• Not considering timing of cash movements
A startup has $600,000 in cash and burns $40,000 per month. If they plan to raise a Series A round in 18 months, do they have enough runway? If not, how much additional funding do they need to reach the fundraising milestone?
Step 1: Calculate current runway = Current Cash ÷ Monthly Burn Rate
Current Runway = $600,000 ÷ $40,000 = 15 months
Step 2: Compare to fundraising timeline
Required Runway = 18 months
Current Runway = 15 months
Step 3: Calculate shortfall = Required - Current = 18 - 15 = 3 months
Step 4: Calculate additional funding needed = 3 months × $40,000 = $120,000
Alternatively: Total cash needed = 18 months × $40,000 = $720,000
Additional funding = $720,000 - $600,000 = $120,000
Therefore, the startup does not have enough runway and needs an additional $120,000 to reach their fundraising milestone.
This problem demonstrates the critical relationship between burn rate and funding timelines. Companies must maintain adequate runway to reach their next funding milestone. The calculation shows that the startup will run out of cash 3 months before their planned fundraising, highlighting the need for either reduced burn rate or additional funding to bridge the gap.
Runway: Time remaining before cash depletion
Fundraising Milestone: Target date for securing additional funding
Cash Buffer: Additional cash maintained for safety
• Runway should exceed fundraising timeline
• Maintain safety buffer beyond milestone
• Plan funding rounds well in advance
• Plan for 12+ months of runway
• Factor in fundraising timeline uncertainty
• Consider market conditions affecting fundraising
• Underestimating fundraising timeline
• Not accounting for market conditions
• Forgetting to include safety margin
A company currently has $800,000 cash, monthly expenses of $50,000, and monthly revenue of $20,000. If they can grow their revenue by 10% monthly, how will this affect their burn rate and runway over the next 6 months? Calculate the new burn rate and runway.
Current situation:
Current Burn Rate = $50,000 - $20,000 = $30,000 per month
Current Runway = $800,000 ÷ $30,000 = 26.7 months
With 10% monthly revenue growth:
Month 1: Revenue = $20,000 × 1.10 = $22,000
Burn Rate = $50,000 - $22,000 = $28,000
Month 6: Revenue = $20,000 × (1.10)^6 = $20,000 × 1.772 = $35,440
Burn Rate = $50,000 - $35,440 = $14,560
Average burn rate over 6 months ≈ $22,000 per month
New runway with improved burn rate ≈ $800,000 ÷ $22,000 = 36.4 months
Impact: Revenue growth reduces monthly burn rate from $30,000 to $14,560 by month 6, extending runway from 26.7 to approximately 36.4 months. This demonstrates how revenue growth can significantly improve cash sustainability.
This problem illustrates the powerful impact of revenue growth on cash sustainability. As revenue increases while expenses remain stable, the burn rate decreases, extending the company's runway. The compounding effect of percentage growth means that the impact becomes more pronounced over time, creating an accelerating improvement in financial position.
Revenue Growth: Increase in revenue over time
Compounding Effect: Exponential growth impact
Cash Sustainability: Ability to maintain operations
• Revenue growth reduces burn rate
• Percentage growth compounds over time
• Stable expenses amplify revenue impact
• Focus on revenue growth to improve burn rate
• Track revenue growth rate separately
• Consider the compounding effect in projections
• Not accounting for revenue growth in projections
• Assuming expenses will grow proportionally
• Forgetting the compounding effect of growth
Which of the following strategies would be MOST effective for reducing cash burn rate?
The answer is B) Reduce non-essential expenses and optimize operations. Reducing expenses directly lowers the cash burn rate immediately, extending the company's runway without requiring external funding. While other strategies might be valuable in the long term, expense reduction has the most immediate impact on burn rate.
This question highlights the difference between immediate and long-term strategies for improving cash position. Reducing expenses directly impacts the burn rate calculation, while other strategies (like increasing revenue or raising funding) may take time to implement and realize benefits. Operational optimization often provides the quickest path to reducing burn rate.
Immediate Impact: Strategies that affect metrics right away
Operational Efficiency: Optimizing processes to reduce costs
Non-Essential Expenses: Costs not critical to core operations
• Expense reduction has immediate effect
• Revenue growth takes time to impact
• Operational efficiency creates sustainable improvements
• Conduct regular expense reviews
• Negotiate better terms with vendors
• Eliminate redundant services
• Focusing only on raising more funding
• Not reviewing expenses regularly
• Confusing growth spending with waste
FAQ
Q: What's the difference between gross burn and net burn?
A: Gross Burn is the total amount of money spent each month:
\( \text{Gross Burn} = \text{Total Monthly Expenses} \)
Net Burn is the net cash consumed after accounting for revenue:
\( \text{Net Burn} = \text{Total Monthly Expenses} - \text{Total Monthly Revenue} \)
For example, if monthly expenses are $60,000 and revenue is $25,000:
Gross Burn: $60,000
Net Burn: $60,000 - $25,000 = $35,000
Net burn is the more important metric as it shows the actual cash drain on the business. Gross burn tells you your cost structure, while net burn tells you how much cash you're actually consuming each month.
Q: How often should I calculate and review my cash burn rate?
A: The frequency depends on your business stage and cash situation:
Well-funded companies: Monthly review is sufficient
Companies with 6-12 months runway: Weekly monitoring recommended
Companies with less than 6 months runway: Daily tracking may be necessary
Best practices include:
- Calculate burn rate monthly as a standard metric
- Review weekly if runway is under 12 months
- Track leading indicators (sales pipeline, payment collections)
- Update projections monthly with actual results
For early-stage companies, weekly reviews are crucial as small changes in revenue or expenses can significantly impact runway calculations.