EBITDA Calculator
Profitability analysis • 2026 best practices
EBITDA Formula:
Show the calculator\( \text{EBITDA} = \text{Net Income} + \text{Interest} + \text{Taxes} + \text{Depreciation} + \text{Amortization} \)
Or alternatively:
\( \text{EBITDA} = \text{Operating Income} + \text{Depreciation} + \text{Amortization} \)
Where:
- \( \text{EBITDA} \) = Earnings Before Interest, Taxes, Depreciation, and Amortization
- \( \text{Net Income} \) = Total earnings after expenses
- \( \text{Interest} \) = Interest expense on debt
- \( \text{Taxes} \) = Income tax expense
- \( \text{Depreciation} \) = Non-cash expense for asset wear
- \( \text{Amortization} \) = Non-cash expense for intangible assets
EBITDA measures a company's operating performance by excluding non-operating expenses and non-cash charges. It's widely used for valuation, loan covenant compliance, and comparing companies across different capital structures. A higher EBITDA indicates better operational efficiency and cash generation potential.
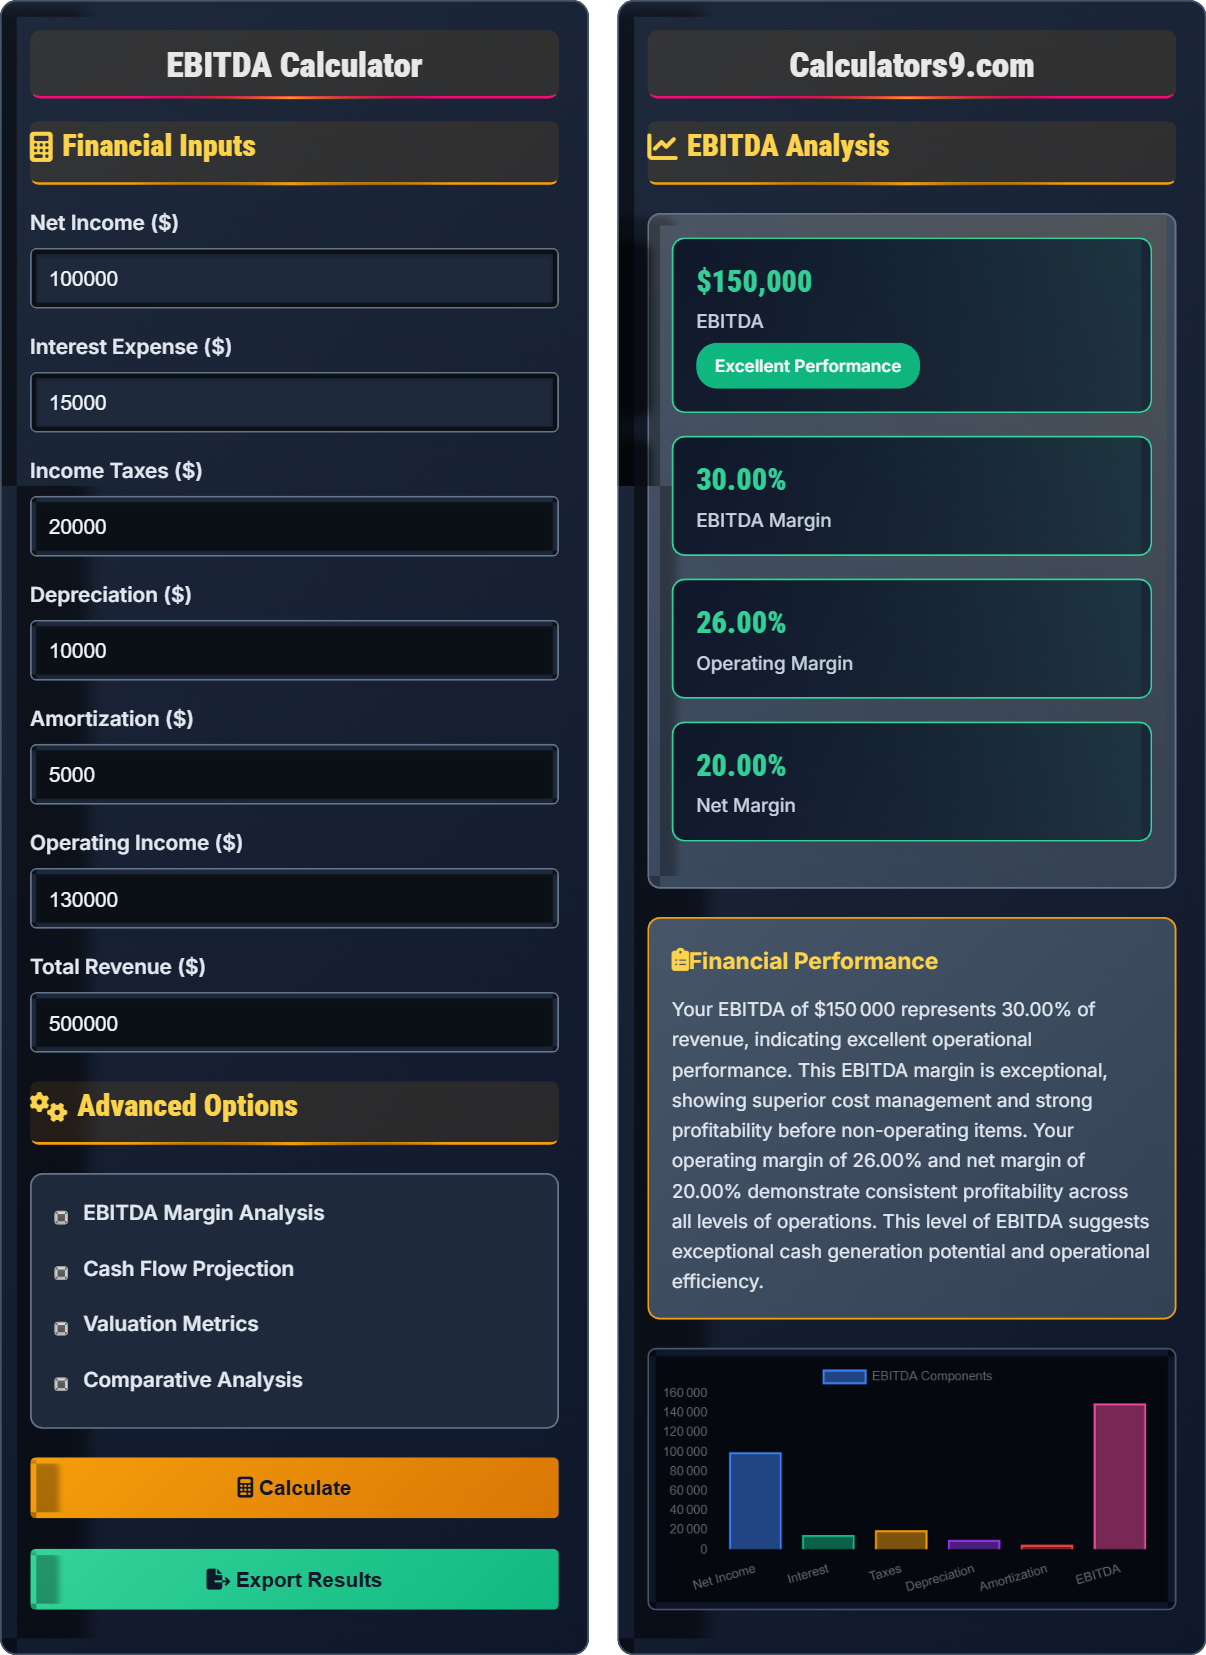
Example: For a company with $100,000 net income, $15,000 interest, $20,000 taxes, $10,000 depreciation, and $5,000 amortization:
EBITDA = $100,000 + $15,000 + $20,000 + $10,000 + $5,000 = $150,000
This $150,000 EBITDA indicates strong operational performance before non-operating items.
Financial Inputs
Advanced Options
EBITDA Analysis
| Metric | Value | Industry Benchmark | Status |
|---|
| Component | Amount | % of EBITDA | Significance |
|---|
Comprehensive EBITDA Analysis Guide
EBITDA (Earnings Before Interest, Taxes, Depreciation, and Amortization) is a measure of a company's operating performance. It represents earnings before accounting for interest, taxes, depreciation, and amortization expenses. EBITDA is widely used because it eliminates the effects of financing and accounting decisions, allowing for better comparison between companies. It's particularly useful for valuing companies and assessing their operational efficiency.
Key metrics derived from EBITDA:
EBITDA Margin: (EBITDA ÷ Revenue) × 100
EBITDA Coverage: EBITDA ÷ Total Debt Service
These metrics help evaluate business financial health and compare against industry standards.
Typical EBITDA margins by industry:
- Technology: 25-40% (high margins, scalable)
- Retail: 8-15% (competitive pressure)
- Manufacturing: 12-20% (capital intensive)
- Healthcare: 15-25% (regulated industry)
- Financial Services: 20-30% (fee-based services)
- Monitor EBITDA monthly to identify trends
- Compare to industry benchmarks for context
- Analyze components for improvement opportunities
- Consider sustainable growth in EBITDA
- Balance profitability with investment needs
EBITDA Fundamentals
Earnings before interest, taxes, depreciation, and amortization (operational profitability).
EBITDA = Net Income + Interest + Taxes + Depreciation + Amortization
EBITDA = Operating Income + Depreciation + Amortization
- Higher EBITDA indicates better operational performance
- Compare to industry averages for context
- Does not account for capital expenditures
Performance Analysis
Above 25% = Excellent, 20-25% = Very Good, 15-20% = Good, Below 10% = Concerning.
- Improve revenue streams
- Optimize operational efficiency
- Manage cost structure
- Focus on high-margin activities
- Does not reflect capital expenditure needs
- Industry structure impacts benchmarks
- Quality of earnings matters
- Market conditions influence performance
EBITDA Analysis Learning Quiz
Which of the following is added back to net income to calculate EBITDA?
The answer is D) All of the above. EBITDA stands for Earnings Before Interest, Taxes, Depreciation, and Amortization. All four items (Interest Expense, Taxes, Depreciation, and Amortization) are added back to net income to calculate EBITDA. This removes the effects of financing decisions, tax environments, and accounting choices to focus on operational performance.
Students must understand that EBITDA removes the effects of non-operating items and non-cash charges. By adding back interest, taxes, depreciation, and amortization, we isolate the core operational performance of the business. This allows for better comparison between companies with different capital structures, tax strategies, and depreciation policies.
EBITDA: Earnings Before Interest, Taxes, Depreciation, and Amortization
Non-Cash Charges: Expenses that don't require cash outflow
Operational Performance: Core business efficiency
• EBITDA = Net Income + Interest + Taxes + Depreciation + Amortization
• Removes non-operating effects
• Focuses on operational performance
• Remember: EBITDA adds back all four items
• Focuses on operational performance
• Compare across different companies
• Forgetting to add back all components
• Confusing EBITDA with net income
• Not understanding the purpose of adjustments
Calculate EBITDA for a company with $80,000 net income, $10,000 interest expense, $15,000 taxes, $8,000 depreciation, and $2,000 amortization. Show your work.
Step 1: Apply the EBITDA formula
EBITDA = Net Income + Interest + Taxes + Depreciation + Amortization
EBITDA = $80,000 + $10,000 + $15,000 + $8,000 + $2,000
EBITDA = $115,000
Step 2: Interpret the result
This means the company generated $115,000 in earnings before accounting for interest, taxes, depreciation, and amortization expenses.
Therefore, the EBITDA is $115,000.
This calculation demonstrates the fundamental formula for EBITDA. By adding back interest, taxes, depreciation, and amortization to net income, we arrive at the operational earnings of the business. This $115,000 figure represents the company's ability to generate cash from its core operations before considering financing costs and tax obligations.
EBITDA: Operational earnings before non-operating items
Operational Performance: Core business efficiency
Financial Performance: How well a company generates returns
• EBITDA = Net Income + Interest + Taxes + Depreciation + Amortization
• Measures operational performance
• Higher EBITDA indicates better performance
• Add back all four components
• Calculate each component separately
• Compare to industry benchmarks
• Forgetting to add back all components
• Using wrong values in calculation
• Not understanding the purpose
A company has an EBITDA of $200,000 and total revenue of $800,000. What is their EBITDA margin, and how does this compare to the industry benchmark of 25%?
Step 1: Calculate EBITDA margin
EBITDA Margin = (EBITDA ÷ Revenue) × 100
EBITDA Margin = ($200,000 ÷ $800,000) × 100
EBITDA Margin = 0.25 × 100 = 25%
Step 2: Compare to industry benchmark
The company's EBITDA margin of 25% exactly matches the industry benchmark of 25%, indicating that the company is performing at the industry average level in terms of operational efficiency relative to revenue.
Step 3: Interpret the result
This means for every dollar of revenue, the company generates 25 cents in EBITDA before considering interest, taxes, depreciation, and amortization.
Therefore, the EBITDA margin is 25%, matching the industry benchmark.
This problem demonstrates how to calculate and interpret EBITDA margin. The margin shows the percentage of revenue that remains as EBITDA, providing insight into operational efficiency. A 25% margin indicates that the company is effectively managing its operational costs relative to its revenue generation, matching industry standards.
EBITDA Margin: Percentage of revenue remaining as EBITDA
Operational Efficiency: How effectively resources are used
Performance Benchmark: Standard for comparison
• EBITDA Margin = (EBITDA ÷ Revenue) × 100
• Measures operational efficiency
• Compare to industry averages
• Calculate margin as percentage
• Compare to industry benchmarks
• Higher margins indicate better efficiency
• Forgetting to multiply by 100 for percentage
• Using wrong denominator in calculation
• Not comparing to benchmarks
A technology company has an EBITDA margin of 32% while the industry average is 28%. The company has $1,000,000 in revenue. What does this indicate about their performance, and how much more EBITDA are they generating compared to the industry average?
Current Situation:
Company EBITDA = $1,000,000 × 32% = $320,000
Industry Average EBITDA = $1,000,000 × 28% = $280,000
Excess EBITDA = $320,000 - $280,000 = $40,000
Analysis:
The company's 32% EBITDA margin is 4 percentage points higher than the industry average of 28%, indicating superior operational efficiency. They generate $40,000 more in EBITDA than the industry average for the same revenue level. This suggests excellent cost management and operational performance.
Recommendations:
- Maintain current operational excellence
- Continue focus on high-margin products
- Scale operations efficiently
- Consider market expansion opportunities
This problem demonstrates the importance of industry benchmarking. The 4 percentage point difference represents $40,000 in additional EBITDA for a $1,000,000 revenue company. This quantifies the performance advantage and shows the value of superior operational efficiency. The company's performance significantly exceeds industry standards.
Industry Benchmark: Standard for performance comparison
Performance Gap: Difference from industry average
Operational Efficiency: How effectively resources are used
• Compare to industry averages
• Quantify the performance gap
• Set realistic improvement targets
• Research industry benchmarks
• Quantify the financial impact
• Focus on high-impact improvements
• Not comparing to industry standards
• Ignoring market conditions
• Setting inappropriate benchmarks
Which EBITDA margin indicates the strongest operational performance?
The answer is D) 35%. EBITDA margin measures operational efficiency by showing the percentage of revenue remaining as EBITDA. A higher margin indicates better operational performance and more efficient cost management. A 35% margin means the company retains 35 cents of every dollar of revenue as EBITDA, providing the strongest operational performance among the options.
Students must understand that EBITDA margins work directly - higher is better. A 35% margin means for every dollar of revenue, there are 35 cents of EBITDA remaining, representing excellent operational efficiency. In contrast, a 10% margin means only 10 cents of EBITDA per dollar of revenue, indicating weaker performance. This fundamental concept is crucial for interpreting operational efficiency.
Operational Performance: Measure of business effectiveness
Financial Performance: Overall financial condition
EBITDA Interpretation: Understanding what values mean
• Higher margins = better performance
• Compare to industry benchmarks
• Context matters for interpretation
• Remember: Higher margins = better
• Consider industry context
• Look for trends over time
• Assuming lower margins are better
• Not considering industry differences
• Ignoring quality of earnings
FAQ
Q: What's a good EBITDA margin for my investment?
A: Good EBITDA margins vary by industry:
- Technology: 25-40% (high margins, scalable)
- Retail: 8-15% (competitive pressure)
- Manufacturing: 12-20% (capital intensive)
- Healthcare: 15-25% (regulated industry)
Mathematically, if your EBITDA is \( E \) and revenue is \( R \), then:
\( \text{EBITDA Margin} = \left(\frac{E}{R}\right) \times 100 \)
For example, with \( E = \$150{,}000 \) and \( R = \$500{,}000 \):
\( \text{EBITDA Margin} = \left(\frac{150{,}000}{500{,}000}\right) \times 100 = 30\% \)
This 30% would be excellent for most industries, especially technology.
Q: How does EBITDA differ from net income?
A: EBITDA excludes interest, taxes, depreciation, and amortization while net income includes all expenses:
EBITDA = Operating Income + Depreciation + Amortization
Net Income = Revenue - All Expenses (including interest and taxes)
For example, with Operating Income = \( \$130{,}000 \), Depreciation = \( \$10{,}000 \), Amortization = \( \$5{,}000 \), Interest = \( \$15{,}000 \), and Taxes = \( \$20{,}000 \):
- EBITDA = \( \$130{,}000 + \$10{,}000 + \$5{,}000 = \$145{,}000 \)
- Net Income = \( \$145{,}000 - \$15{,}000 - \$20{,}000 = \$110{,}000 \)
EBITDA focuses on operational performance while net income reflects total profitability.