Gross Profit Calculator
Revenue & cost analysis • 2026 best practices
Gross Profit Formulas:
Show the calculatorGross Profit: \( \text{Gross Profit} = \text{Revenue} - \text{Cost of Goods Sold (COGS)} \)
Gross Margin: \( \text{Gross Margin \%} = \frac{\text{Gross Profit}}{\text{Revenue}} \times 100 \)
Break-Even Point: \( \text{Units} = \frac{\text{Fixed Costs}}{\text{Price per Unit} - \text{Variable Cost per Unit}} \)
Where:
- \( \text{Revenue} \) = Total sales income
- \( \text{COGS} \) = Direct costs of producing goods sold
- \( \text{Gross Profit} \) = Profit before operating expenses
- \( \text{Gross Margin} \) = Percentage of revenue remaining after COGS
Gross profit measures profitability after direct production costs. Healthy margins vary by industry: retail typically 20-25%, manufacturing 15-30%, software 80-90%. Gross margin indicates pricing power and cost control effectiveness.
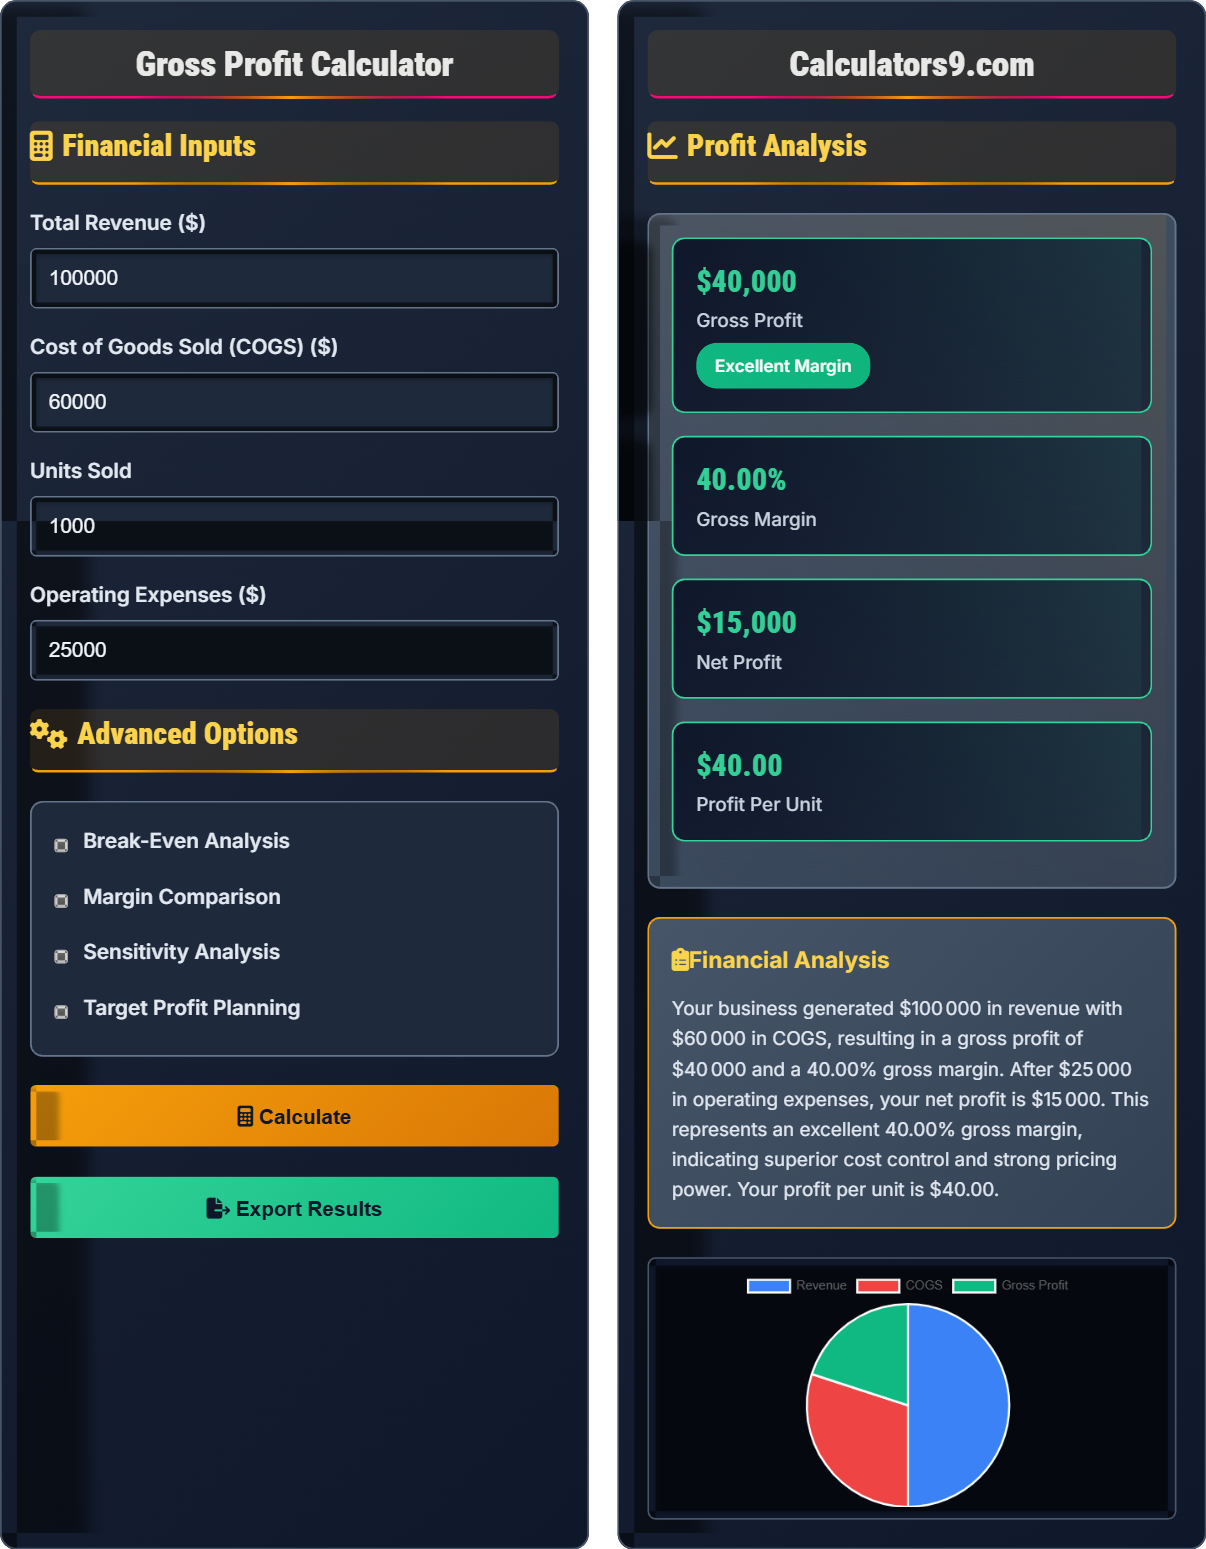
Example: For a company with $100,000 revenue and $60,000 COGS:
Gross Profit = $100,000 - $60,000 = $40,000
Gross Margin = ($40,000 ÷ $100,000) × 100 = 40%
This 40% gross margin indicates strong pricing power and cost management.
Financial Inputs
Advanced Options
Profit Analysis
| Item | Amount | % of Revenue |
|---|
| Margin Type | Value | Industry Benchmark |
|---|
Comprehensive Profit Analysis Guide
Gross profit is the revenue a company earns from selling its products minus the direct costs associated with producing those products. It excludes operating expenses, taxes, and other indirect costs. Gross profit indicates how efficiently a company produces and sells its goods, reflecting the core profitability of its business model.
Key profitability metrics and their significance:
Operating Margin: Gross Profit - Operating Expenses
Net Margin: Final profit after all expenses
These metrics help evaluate business performance and compare against industry standards.
Typical gross margin ranges by industry:
- Software/Tech: 80-90% (high scalability)
- Retail: 20-25% (competitive pricing)
- Manufacturing: 15-30% (material costs)
- Restaurants: 30-35% (food costs)
- Automotive: 15-20% (high competition)
- Track margins monthly to identify trends
- Compare to industry benchmarks for context
- Analyze by product line to optimize offerings
- Monitor COGS trends to manage costs
- Plan for seasonal variations in margins
Profit Fundamentals
Revenue minus cost of goods sold (before operating expenses).
Gross Profit = Revenue - COGS
Gross Margin % = (Gross Profit ÷ Revenue) × 100
- Gross profit excludes operating expenses
- Higher margins indicate better efficiency
- Compare to industry averages for context
Margin Analysis
40%+ = Excellent, 25-40% = Good, 15-25% = Average, Below 15% = Concerning.
- Analyze cost structure
- Optimize pricing strategy
- Review product mix
- Negotiate supplier terms
- Seasonal variations affect margins
- Volume discounts impact COGS
- Market conditions influence pricing
- Competition affects margin sustainability
Profit Analysis Learning Quiz
Which of the following is included in the calculation of gross profit?
The answer is B) Cost of Goods Sold (COGS). Gross profit is calculated as Revenue minus COGS. COGS includes direct materials, labor, and manufacturing overhead associated with producing the goods sold. Marketing expenses, administrative salaries, and interest expense are operating expenses that come after gross profit to calculate net income.
Students must understand the distinction between direct costs (included in COGS) and indirect costs (operating expenses). COGS directly relates to the production of goods sold, while operating expenses support the business but aren't directly tied to production. This distinction is fundamental to financial statement analysis and profitability assessment.
Cost of Goods Sold (COGS): Direct costs attributable to the production of goods sold
Operating Expenses: Indirect costs not directly tied to production
Gross Profit: Revenue minus COGS
• COGS is subtracted from revenue for gross profit
• Operating expenses come after gross profit
• COGS includes direct materials and labor
• Remember: COGS affects gross profit
• Operating expenses affect net profit
• COGS varies with sales volume
• Including operating expenses in COGS
• Confusing gross profit with net profit
• Misclassifying direct vs. indirect costs
Calculate the gross profit and gross margin percentage for a company with $150,000 in revenue and $90,000 in COGS. Show your work.
Step 1: Calculate Gross Profit
Gross Profit = Revenue - COGS
Gross Profit = $150,000 - $90,000 = $60,000
Step 2: Calculate Gross Margin Percentage
Gross Margin % = (Gross Profit ÷ Revenue) × 100
Gross Margin % = ($60,000 ÷ $150,000) × 100 = 0.4 × 100 = 40%
Therefore, the gross profit is $60,000 and the gross margin is 40%.
This calculation demonstrates the fundamental profit margin formula. A 40% gross margin indicates that for every dollar of revenue, 40 cents remain after covering the direct costs of production. This margin provides coverage for operating expenses and profit. Understanding this relationship helps in pricing decisions and cost management.
Gross Profit: Revenue minus cost of goods sold
Gross Margin: Gross profit expressed as percentage of revenue
Profitability Ratio: Measures efficiency of generating profit
• Gross Profit = Revenue - COGS
• Gross Margin % = (Gross Profit ÷ Revenue) × 100
• Higher margins indicate better efficiency
• Remember: Margin = Profit ÷ Revenue
• Convert to percentage by multiplying by 100
• Compare to industry benchmarks
• Forgetting to convert to percentage
• Using net profit instead of gross profit
• Dividing by wrong denominator
A company sells widgets for $50 each. The variable cost per unit is $30, and total fixed costs are $40,000. How many units must be sold to break even? What is the revenue at the break-even point?
Step 1: Calculate Contribution Margin per Unit
Contribution Margin = Selling Price - Variable Cost
Contribution Margin = $50 - $30 = $20 per unit
Step 2: Calculate Break-Even Units
Break-Even Units = Fixed Costs ÷ Contribution Margin per Unit
Break-Even Units = $40,000 ÷ $20 = 2,000 units
Step 3: Calculate Break-Even Revenue
Break-Even Revenue = Break-Even Units × Selling Price
Break-Even Revenue = 2,000 × $50 = $100,000
Therefore, the company must sell 2,000 units to break even, generating $100,000 in revenue.
Break-even analysis helps determine the minimum sales volume needed to cover all costs. The contribution margin represents how much each unit contributes to covering fixed costs after variable costs are covered. Once fixed costs are recovered, additional sales contribute directly to profit. This analysis is crucial for pricing and volume decisions.
Break-Even Point: Sales level where total revenue equals total costs
Contribution Margin: Revenue remaining after variable costs
Fixed Costs: Costs that don't vary with sales volume
• BE Units = Fixed Costs ÷ Contribution Margin
• Contribution Margin = Price - Variable Cost
• Above BE point = Profit, Below = Loss
• Calculate contribution margin first
• Fixed costs remain constant
• Variable costs change with volume
• Mixing up fixed and variable costs
• Forgetting to include all fixed costs
• Calculating margin incorrectly
A company currently has $200,000 revenue, $150,000 COGS, and 25% gross margin. They want to improve their gross margin to 30%. What strategies could they implement, and what would be the required COGS to achieve this target?
Current Analysis:
Current Gross Profit = $200,000 - $150,000 = $50,000
Current Gross Margin = ($50,000 ÷ $200,000) × 100 = 25%
Target Analysis:
Target Gross Profit = Revenue × Target Margin
Target Gross Profit = $200,000 × 30% = $60,000
Required COGS = Revenue - Target Gross Profit
Required COGS = $200,000 - $60,000 = $140,000
Improvement Strategies:
- Negotiate better supplier terms to reduce COGS
- Improve production efficiency
- Shift to higher-margin products
- Optimize inventory management
- Reduce waste in production process
To achieve a 30% gross margin, COGS must be reduced from $150,000 to $140,000.
This problem demonstrates how to use profit margin formulas for planning. To achieve a target margin, you can work backwards from the desired result. The analysis shows that achieving a 5 percentage point margin improvement requires a $10,000 reduction in COGS. This approach helps in setting realistic targets and identifying specific improvement opportunities.
Target Margin: Desired profitability percentage
Cost Reduction: Decreasing expenses to improve margins
Margin Planning: Setting and achieving profitability goals
• Work backwards from target margin
• Margin = (Revenue - COGS) ÷ Revenue
• Solve for unknown variable
• Set realistic margin targets
• Identify specific cost reduction opportunities
• Monitor progress monthly
• Setting unrealistic margin targets
• Not considering market constraints
• Ignoring volume implications
Which industry typically has the highest gross profit margins?
The answer is B) Software/Technology. Software companies typically have gross margins of 80-90% because their products have high upfront development costs but minimal ongoing production costs. Once developed, software can be reproduced and distributed at very low marginal cost, resulting in exceptionally high margins compared to other industries.
Students must understand that business models significantly impact profit margins. Software companies benefit from economies of scale - the more they sell, the higher their margins become since the development costs are fixed. In contrast, retail and restaurants have significant ongoing costs (inventory, food), limiting their margins. This knowledge is essential for industry comparisons and performance evaluation.
Business Model: How a company generates revenue and profits
Economies of Scale: Cost advantages from increased production
Industry Benchmark: Standard for performance comparison
• Compare margins within same industry
• Consider business model differences
• Factor in industry-specific costs
• Research industry benchmarks
• Understand cost structures
• Consider market dynamics
• Comparing margins across different industries
• Not considering business model differences
• Ignoring market conditions
FAQ
Q: What's a good gross profit margin for my business?
A: Good gross margins vary significantly by industry:
- Software/tech: 80-90%
- Retail: 20-25%
- Manufacturing: 15-30%
- Restaurants: 30-35%
Mathematically, if your revenue is \( R \) and COGS is \( C \), then:
\( \text{Gross Margin} = \left(\frac{R - C}{R}\right) \times 100 \)
For example, with \( R = \$100{,}000 \) and \( C = \$60{,}000 \):
\( \text{Gross Margin} = \left(\frac{100{,}000 - 60{,}000}{100{,}000}\right) \times 100 = 40\% \)
This 40% would be considered excellent for most industries outside tech.
Q: How does gross profit differ from net profit?
A: Gross profit considers only direct costs (COGS), while net profit accounts for all expenses:
Gross Profit = Revenue - COGS
Net Profit = Gross Profit - Operating Expenses - Taxes - Interest
For example, with Revenue = \( \$100{,}000 \), COGS = \( \$60{,}000 \), Operating Expenses = \( \$25{,}000 \):
- Gross Profit = \( \$100{,}000 - \$60{,}000 = \$40{,}000 \)
- Net Profit = \( \$40{,}000 - \$25{,}000 = \$15{,}000 \)
Gross profit shows production efficiency, while net profit reflects overall business performance.