Inventory Turnover Calculator
Optimize stock performance • 2026 best practices
Inventory Turnover Formula:
Show the calculator\( \text{Inventory Turnover Ratio} = \frac{\text{Cost of Goods Sold (COGS)}}{\text{Average Inventory}} \)
Where:
- \( \text{COGS} \) = Cost of Goods Sold during the period
- \( \text{Average Inventory} \) = (Beginning Inventory + Ending Inventory) ÷ 2
The inventory turnover ratio measures how efficiently a company sells its inventory. A higher ratio indicates faster inventory movement and better liquidity. Industry benchmarks vary: retail typically ranges 4-6, manufacturing 2-4, and automotive around 8-12.
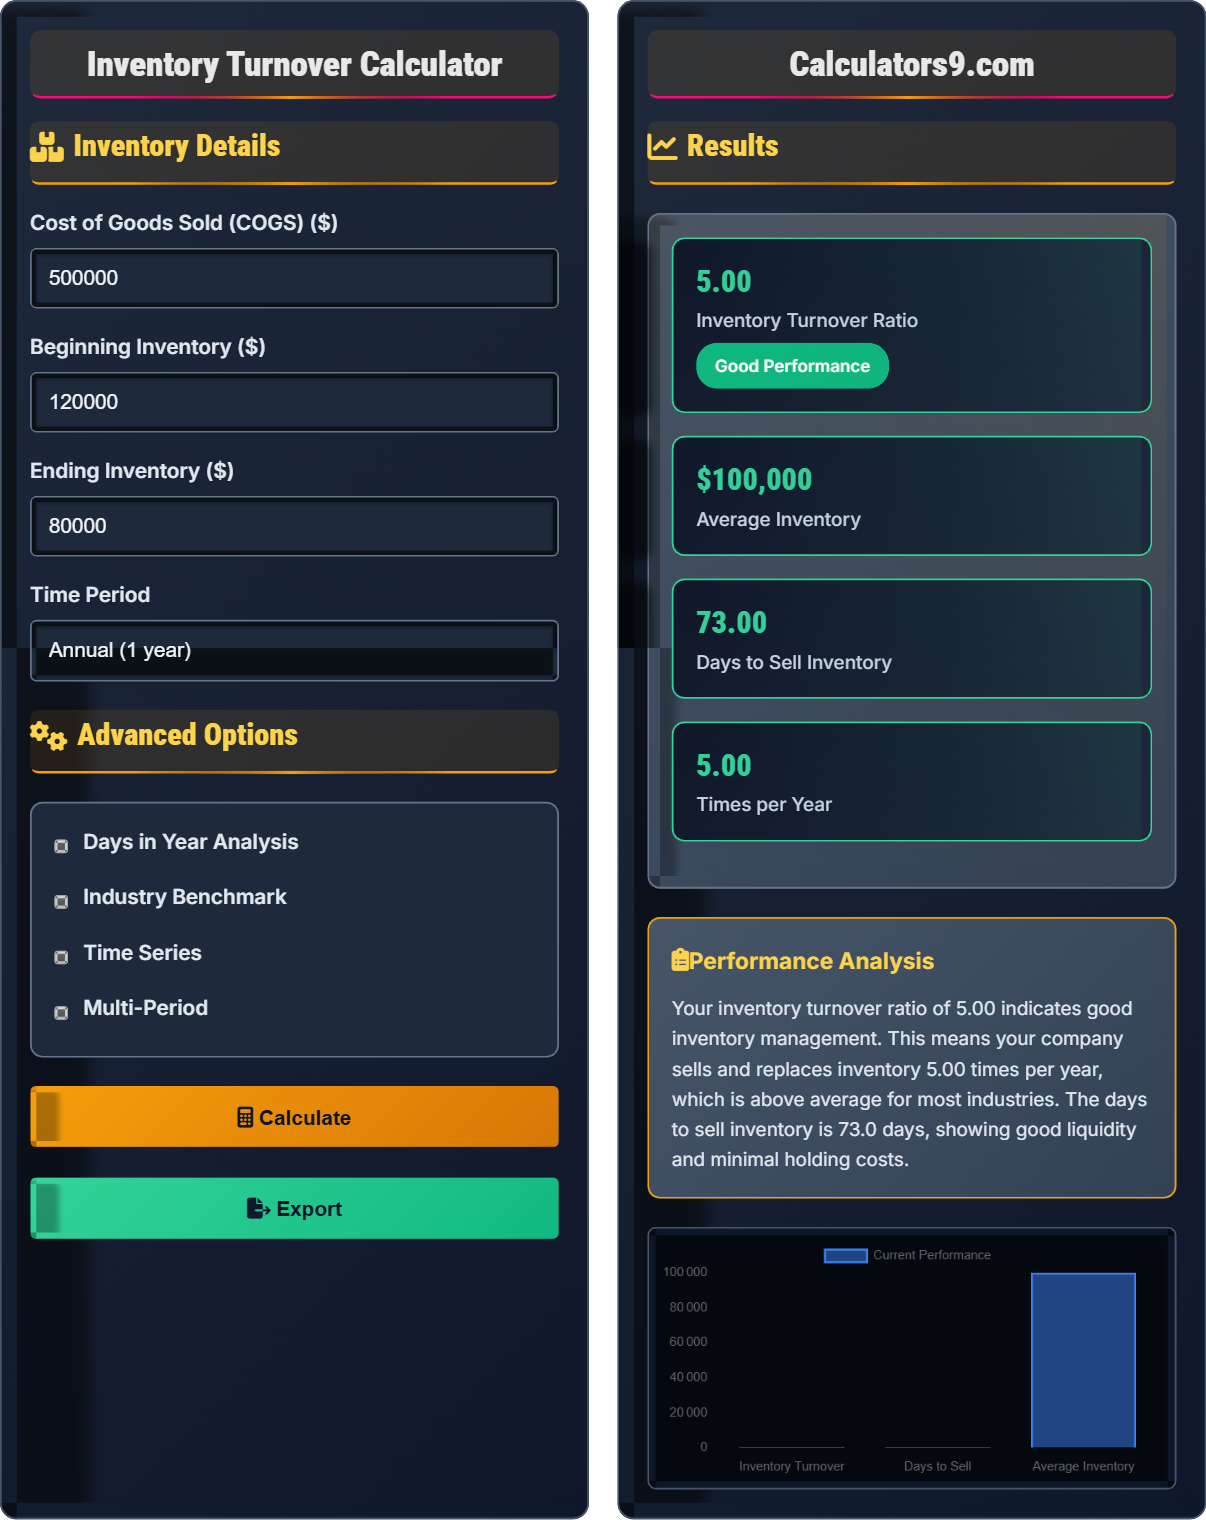
Example: For a company with COGS of $500,000 and average inventory of $100,000:
\( \text{Inventory Turnover} = \frac{500,000}{100,000} = 5.0 \)
This means the company sells and replaces its inventory 5 times per year, indicating good inventory management efficiency.
Inventory Details
Advanced Options
Results
| Metric | Value | Interpretation |
|---|
| Industry | Typical Range | Your Performance |
|---|
Comprehensive Inventory Management Guide
Inventory turnover is a financial ratio that measures how many times a company's inventory is sold and replaced over a specific period. It's a critical metric for evaluating the efficiency of inventory management and the effectiveness of sales operations. A high turnover ratio suggests strong sales and efficient inventory management, while a low ratio may indicate poor sales, excess inventory, or inefficient management.
The standard inventory turnover calculation uses the following formula:
Where:
- \( \text{COGS} \) = Cost of Goods Sold during the period
- \( \text{Average Inventory} \) = (Beginning Inventory + Ending Inventory) ÷ 2
Inventory turnover ratios vary significantly across industries:
- Retail: 4-6 turns per year (fast-moving consumer goods)
- Manufacturing: 2-4 turns per year (longer production cycles)
- Automotive: 8-12 turns per year (high volume, lower margins)
- Luxury Goods: 1-2 turns per year (higher margins, slower sales)
- Just-in-Time (JIT): Minimize inventory levels by receiving goods only as needed for production
- Economic Order Quantity (EOQ): Optimize order quantities to minimize carrying and ordering costs
- ABC Analysis: Categorize inventory by importance and manage accordingly
- Seasonal Adjustments: Adjust inventory levels based on seasonal demand patterns
- Demand Forecasting: Use historical data and trends to predict future inventory needs
Inventory Turnover Basics
Ratio measuring how many times inventory is sold and replaced.
\( \text{ITR} = \frac{\text{COGS}}{\text{Avg Inv}} \)
Where ITR=inventory turnover ratio, COGS=cost of goods sold, Avg Inv=average inventory.
- Higher ratios indicate better efficiency
- Compare to industry benchmarks
- Consider seasonal variations
Performance Indicators
Good: 4-6+ (varies by industry), Poor: Below 2.
- Optimize ordering frequency
- Improve demand forecasting
- Implement JIT systems
- Reduce slow-moving items
- High turnover may indicate stockouts
- Low turnover suggests excess inventory
- Seasonal businesses need special attention
- Quality of inventory matters too
Inventory Turnover Learning Quiz
An inventory turnover ratio of 8 means that:
The answer is B) The company sells and replaces its entire inventory 8 times per year. The inventory turnover ratio measures how many times a company's inventory is sold and replaced over a specific period. A ratio of 8 means that the company's entire inventory is sold and replenished 8 times during the year, indicating efficient inventory management.
Understanding the inventory turnover ratio is fundamental to analyzing a company's operational efficiency. The ratio indicates the velocity at which inventory moves through the business. Higher ratios generally suggest better efficiency, but they must be evaluated in context. Students should remember that the ratio represents the number of times inventory is "turned over" or completely sold and replaced within the measurement period.
Inventory Turnover Ratio: A measure of how many times a company's inventory is sold and replaced over a specific period
Cost of Goods Sold (COGS): The direct costs attributable to the production of goods sold by a company
Average Inventory: The mean value of inventory over a specific period, calculated as (Beginning Inventory + Ending Inventory) ÷ 2
• Inventory turnover = COGS ÷ Average Inventory
• Higher ratios indicate faster inventory movement
• Industry benchmarks vary significantly
• Remember: Higher is usually better (but not always)
• Compare against industry averages for context
• Consider seasonal fluctuations in your analysis
• Confusing inventory turnover with days sales of inventory
• Forgetting to use average inventory in calculations
• Not considering industry-specific benchmarks
Calculate the inventory turnover ratio for a company with COGS of $1,200,000, beginning inventory of $250,000, and ending inventory of $150,000. Show your work.
Step 1: Calculate Average Inventory = (Beginning Inventory + Ending Inventory) ÷ 2
Average Inventory = ($250,000 + $150,000) ÷ 2 = $400,000 ÷ 2 = $200,000
Step 2: Apply the inventory turnover formula
Inventory Turnover = COGS ÷ Average Inventory
Inventory Turnover = $1,200,000 ÷ $200,000 = 6.0
Therefore, the company's inventory turnover ratio is 6.0, meaning it sells and replaces its inventory 6 times per year.
This problem demonstrates the critical importance of using average inventory rather than a single point-in-time figure. Beginning and ending inventory values can vary significantly, especially in seasonal businesses. Using average inventory provides a more accurate representation of the inventory base over the measurement period. The resulting ratio of 6.0 is considered quite good for most industries, indicating efficient inventory management.
Average Inventory: The mean value of inventory over a period, accounting for fluctuations
COGS: The total cost of products sold during the period
Inventory Efficiency: How effectively a company manages its inventory investment
• Always use average inventory in the denominator
• COGS should match the time period of the ratio
• Higher ratios generally indicate better efficiency
• Remember: Average Inventory = (Begin + End) ÷ 2
• Verify that COGS and inventory periods align
• Round ratios to 2 decimal places for clarity
• Using only ending inventory instead of average inventory
• Mismatching time periods between COGS and inventory
• Forgetting to divide by average inventory
Electronics Retail Inc. has an inventory turnover ratio of 5.2 and operates in a 365-day year. What is their average days sales of inventory (DSI)? If the industry average is 60 days, how does this company perform?
Step 1: Calculate Days Sales of Inventory (DSI) using the formula
DSI = Days in Period ÷ Inventory Turnover
DSI = 365 ÷ 5.2 = 70.19 days
Step 2: Compare to industry benchmark
The company takes approximately 70 days to sell its inventory, which is 10 days longer than the industry average of 60 days. This suggests the company may have slightly slower inventory movement compared to competitors, potentially indicating room for improvement in inventory management.
This problem connects inventory turnover to days sales of inventory, providing insight into the time dimension of inventory management. DSI translates the abstract turnover ratio into a more intuitive timeframe that managers can relate to. The comparison with industry benchmarks adds practical context to the performance evaluation. While 70 days isn't extremely poor, it indicates potential for improvement in inventory efficiency.
Days Sales of Inventory (DSI): The average number of days it takes to sell inventory
Inventory Liquidity: How quickly inventory can be converted to sales
Industry Benchmark: Standard performance metric for comparison purposes
• DSI = Days in Period ÷ Inventory Turnover
• Lower DSI generally indicates better performance
• Always compare to industry benchmarks
• Remember: DSI = 365 ÷ Turnover Ratio
• Lower DSI means faster inventory movement
• Consider seasonal adjustments for accuracy
• Confusing the formula direction (numerator vs denominator)
• Not comparing results to industry benchmarks
• Forgetting to specify the time period
ABC Manufacturing has an inventory turnover ratio of 3.0, which is below their target of 4.0. Their current COGS is $2,400,000 and average inventory is $800,000. What strategies could they implement to achieve their target turnover ratio, and what would be the impact on their inventory investment?
Current Situation: Inventory Turnover = $2,400,000 ÷ $800,000 = 3.0
To achieve target turnover of 4.0 with same COGS:
Required Average Inventory = COGS ÷ Target Turnover
Required Average Inventory = $2,400,000 ÷ 4.0 = $600,000
Reduction needed = $800,000 - $600,000 = $200,000
Strategies to achieve this:
- Implement Just-in-Time (JIT) inventory system
- Improve demand forecasting accuracy
- Negotiate more frequent deliveries with suppliers
- Reduce slow-moving or obsolete inventory
- Optimize reorder points and safety stock levels
Impact: Reducing average inventory by $200,000 would free up cash flow and reduce carrying costs, improving overall profitability.
This application problem demonstrates how inventory turnover ratios translate into actionable business strategies. By working backwards from the target ratio, we can determine the required inventory level. This approach helps students understand the practical implications of financial ratios. The $200,000 reduction in average inventory represents significant capital that can be redeployed elsewhere in the business, potentially earning returns or reducing financing costs.
Just-in-Time (JIT): Inventory management strategy that minimizes inventory levels
Carrying Costs: Expenses associated with holding inventory
Cash Flow Optimization: Improving the timing and amount of cash receipts and payments• Target Inventory = COGS ÷ Target Turnover
• Reducing inventory frees up working capital
• Balance turnover with stockout risk
• Use ratio targets to set inventory goals
• Consider supplier reliability in JIT planning
• Monitor inventory aging regularly
• Setting unrealistic turnover targets
• Not considering supply chain disruptions
• Ignoring quality and customer service impacts
Which of the following statements about inventory turnover ratios across industries is TRUE?
The answer is B) Grocery stores typically have higher turnover than luxury goods retailers. This is because grocery items are fast-moving consumer goods with high demand and quick sales cycles, whereas luxury goods are typically high-value, slow-moving items with lower sales frequency. Grocery stores often have turnover ratios of 8-12, while luxury goods retailers may have ratios of 1-2.
This question highlights the critical importance of industry context when evaluating inventory turnover ratios. Students must understand that what constitutes a "good" ratio varies dramatically by industry. Fast-moving consumer goods (FMCG) like groceries have high turnover, while specialty or luxury items have lower turnover. Understanding these differences is essential for meaningful financial analysis and competitive benchmarking.
Fast-Moving Consumer Goods (FMCG): Products that sell quickly and have relatively low prices
Industry Benchmarking: Comparing performance metrics against industry standards
Product Lifecycle: The stages a product goes through from introduction to decline
• Always compare ratios within the same industry
• Consider business model and product characteristics
• Account for seasonal variations
• Research industry averages before analysis
• Consider multiple ratios for complete picture
• Account for seasonal business patterns
• Comparing ratios across different industries
• Not considering business model differences
• Ignoring seasonal factors in analysis
FAQ
Q: What is a good inventory turnover ratio for my retail business?
A: For retail businesses, a good inventory turnover ratio typically ranges from 4 to 6 times per year, though this varies by sub-sector. Fast-fashion retailers might achieve 8-10, while furniture retailers may aim for 2-4.
Mathematically, if your COGS is \( \$500{,}000 \) and your average inventory is \( \$100{,}000 \), your turnover ratio is:
\( \text{ITR} = \frac{\$500{,}000}{\$100{,}000} = 5.0 \)
This means you're selling and replacing your entire inventory 5 times annually, which is excellent for most retail categories. However, the optimal ratio depends on your specific product mix, seasonality, and market conditions.
Q: How does inventory turnover relate to cash flow?
A: Inventory turnover directly impacts cash flow. A higher turnover means faster conversion of inventory into sales revenue, improving cash flow velocity. If your inventory turnover increases from 4 to 6, you're freeing up cash that was tied up in inventory twice as fast.
For example, if you have \( \$200{,}000 \) in average inventory:
- At 4x turnover: You convert inventory to cash every 91 days (\( 365 ÷ 4 \))
- At 6x turnover: You convert inventory to cash every 61 days (\( 365 ÷ 6 \))
This 30-day improvement in cash conversion cycle can significantly enhance your working capital efficiency and reduce the need for external financing.