Operating Expense Ratio Calculator
Efficiency analysis • 2026 best practices
Operating Expense Ratio Formula:
Show the calculator\( \text{Operating Expense Ratio} = \frac{\text{Total Operating Expenses}}{\text{Total Revenue}} \times 100 \)
Where:
- \( \text{Operating Expenses} \) = All costs except COGS (salaries, rent, marketing, etc.)
- \( \text{Revenue} \) = Total sales income
- \( \text{Ratio} \) = Percentage of revenue consumed by operating expenses
The operating expense ratio measures how efficiently a company uses its revenue to cover operational costs. Lower ratios indicate better efficiency. Typical benchmarks: retail 25-30%, SaaS 15-25%, manufacturing 20-35%. Ratios above 50% indicate significant cost management issues.
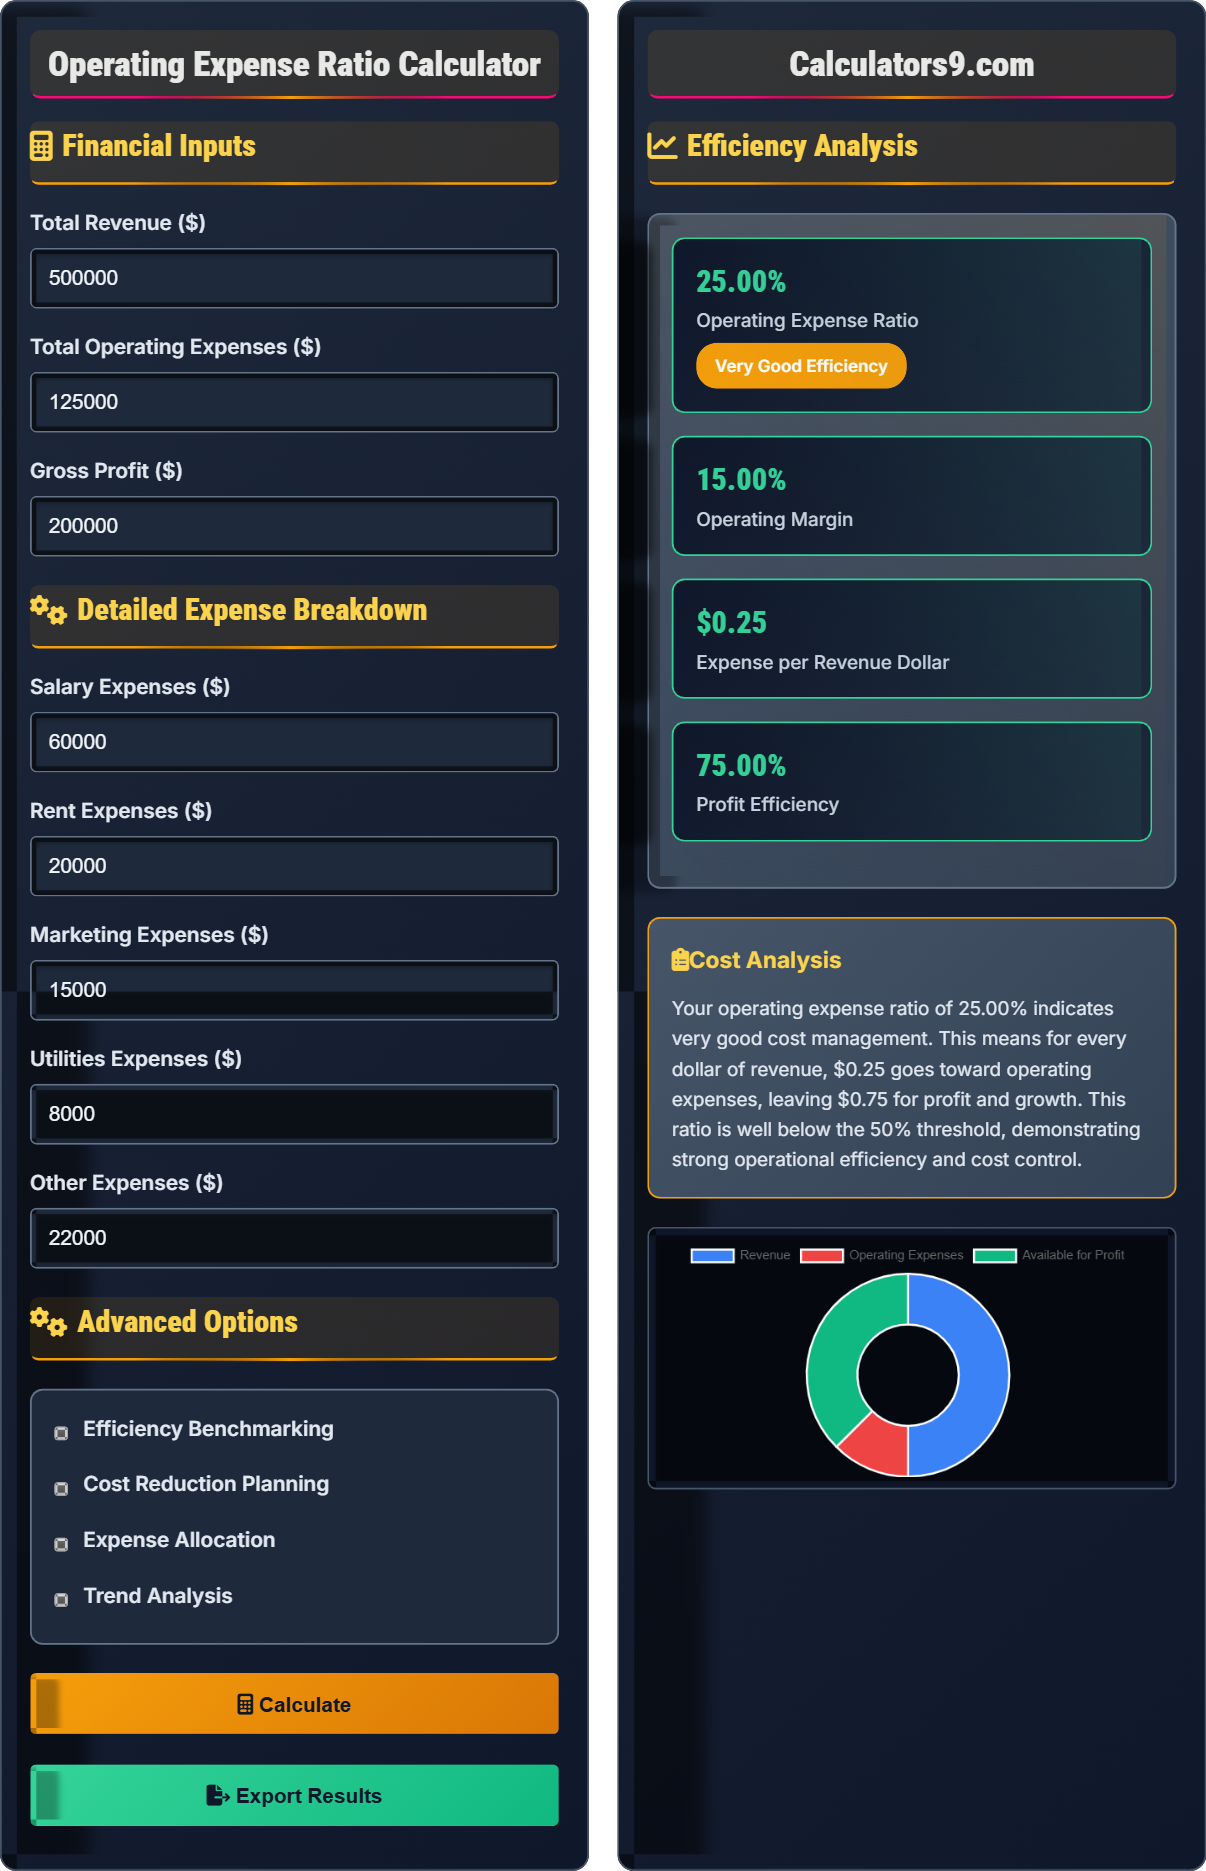
Example: For a company with $500,000 revenue and $125,000 operating expenses:
Operating Expense Ratio = ($125,000 ÷ $500,000) × 100 = 25%
This 25% ratio indicates efficient cost management, leaving 75% of revenue for profit and growth.
Financial Inputs
Detailed Expense Breakdown
Advanced Options
Efficiency Analysis
| Category | Amount | % of Total | % of Revenue |
|---|
| Ratio | Value | Benchmark | Status |
|---|
Comprehensive Expense Management Guide
The operating expense ratio measures the percentage of revenue consumed by operating expenses. It indicates how efficiently a company manages its operational costs relative to its revenue generation. A lower ratio indicates better cost management and operational efficiency. This ratio excludes the cost of goods sold (COGS) and focuses on administrative and operational expenses.
Key ratios for operational efficiency analysis:
Operating Margin: (Gross Profit - OpEx) ÷ Revenue
Efficiency Score: 100 - Operating Expense Ratio
These metrics help evaluate business performance and compare against industry standards.
Typical operating expense ratios by industry:
- SaaS/Technology: 15-25% (high automation)
- Retail: 25-30% (high personnel costs)
- Manufacturing: 20-35% (mixed costs)
- Restaurants: 30-35% (high labor costs)
- Banking: 40-50% (regulatory compliance)
- Track ratios monthly to identify trends
- Compare to industry benchmarks for context
- Set improvement targets based on realistic goals
- Review expense categories quarterly
- Implement cost controls systematically
Expense Fundamentals
Percentage of revenue consumed by operating expenses (excluding COGS).
Operating Expense Ratio = (Operating Expenses ÷ Revenue) × 100
Measures operational efficiency and cost management.
- Lower ratios indicate better efficiency
- Benchmarks vary by industry
- Below 50% is generally acceptable
Efficiency Analysis
Under 20% = Excellent, 20-30% = Good, 30-40% = Average, Above 50% = Concerning.
- Identify high-cost categories
- Implement cost controls
- Automate processes
- Negotiate better terms
- Seasonal variations affect ratios
- Growth investments may temporarily increase ratios
- Quality shouldn't be compromised for cost savings
- Market conditions impact expense structures
Expense Efficiency Learning Quiz
Which of the following is included in the calculation of operating expense ratio?
The answer is B) Salary expenses. The operating expense ratio includes all operating expenses (like salaries, rent, marketing, utilities) divided by total revenue. COGS, raw materials, and direct labor are excluded as they are considered direct costs related to production, not operational overhead.
Students must understand the distinction between direct costs (COGS) and operating expenses. Direct costs are tied to production and are excluded from the operating expense ratio. Operating expenses are the costs of running the business day-to-day, such as salaries, rent, marketing, and administrative costs. This ratio specifically measures operational efficiency.
Operating Expenses: Costs of running business operations (not including COGS)
Cost of Goods Sold (COGS): Direct costs related to production
Operating Expense Ratio: Measure of operational efficiency
• Operating expenses exclude COGS
• Includes salaries, rent, marketing
• Measures operational efficiency
• Remember: OpEx ratio excludes COGS
• Operating expenses = administrative costs
• Lower ratios = better efficiency
• Including COGS in operating expenses
• Confusing direct vs. indirect costs
• Misunderstanding the ratio's purpose
Calculate the operating expense ratio for a company with $800,000 in revenue and $200,000 in operating expenses. Show your work.
Step 1: Apply the operating expense ratio formula
Operating Expense Ratio = (Operating Expenses ÷ Revenue) × 100
Operating Expense Ratio = ($200,000 ÷ $800,000) × 100
Operating Expense Ratio = 0.25 × 100 = 25%
Step 2: Interpret the result
This means 25% of the company's revenue is consumed by operating expenses, leaving 75% for profit and growth. This is considered a good efficiency ratio.
Therefore, the operating expense ratio is 25%.
This calculation demonstrates the fundamental formula for the operating expense ratio. A 25% ratio indicates that for every dollar of revenue, 25 cents goes toward operating expenses. This leaves 75 cents for profit and growth, which is considered efficient. Understanding this relationship helps in evaluating cost management effectiveness.
Operating Expense Ratio: Percentage of revenue consumed by operating expenses
Operational Efficiency: How effectively resources are used
Cost Management: Controlling and optimizing expenses
• Operating Expense Ratio = (OpEx ÷ Revenue) × 100
• Lower ratios indicate better efficiency
• Compare to industry benchmarks
• Remember: OpEx ÷ Revenue × 100
• Convert to percentage by multiplying by 100
• Compare to industry averages
• Forgetting to convert to percentage
• Including COGS in operating expenses
• Dividing by wrong denominator
A company currently has an operating expense ratio of 35% on $600,000 revenue. They want to improve to 30%. How much in operating expenses must they reduce to achieve this target, and what strategies could they implement?
Step 1: Calculate current operating expenses
Current OpEx = $600,000 × 35% = $210,000
Step 2: Calculate target operating expenses
Target OpEx = $600,000 × 30% = $180,000
Step 3: Calculate required reduction
Reduction Needed = $210,000 - $180,000 = $30,000
Strategies to implement:
- Negotiate better terms with vendors
- Implement cost-saving technologies
- Optimize workforce efficiency
- Reduce unnecessary overhead
- Automate routine processes
Therefore, the company must reduce operating expenses by $30,000 to achieve the target ratio.
This problem demonstrates how to use the operating expense ratio for planning and goal-setting. By working backwards from the target ratio, we can determine the specific expense reduction needed. This approach helps in setting realistic targets and identifying concrete improvement opportunities. The $30,000 reduction represents a significant cost savings that directly impacts profitability.
Target Ratio: Desired efficiency percentage
Cost Reduction: Decreasing expenses to improve ratiosEfficiency Planning: Setting and achieving cost goals
• Work backwards from target ratio
• OpEx = Revenue × Ratio
• Solve for required reduction
• Calculate current expenses first
• Determine target expenses
• Find the difference
• Setting unrealistic targets
• Not considering implementation feasibility
• Ignoring quality implications
A retail company has an operating expense ratio of 32% while the industry average is 28%. The company has $1,000,000 in revenue. What does this indicate about their efficiency, and how much more in operating expenses are they spending compared to the industry average?
Current Situation:
Current Operating Expenses = $1,000,000 × 32% = $320,000
Industry Average Expenses = $1,000,000 × 28% = $280,000
Excess Spending = $320,000 - $280,000 = $40,000
Analysis:
The company's 32% ratio is 4 percentage points higher than the industry average of 28%, indicating less efficient cost management. They are spending $40,000 more in operating expenses than the industry average for the same revenue level. This suggests opportunities for cost reduction and efficiency improvements.
Recommendations:
- Conduct detailed expense review
- Implement cost control measures
- Compare processes to industry leaders
- Optimize resource allocation
This problem demonstrates the importance of industry benchmarking. The 4 percentage point difference may seem small, but it represents $40,000 in excess expenses for a $1,000,000 revenue company. This quantifies the efficiency gap and provides a concrete target for improvement. Industry comparisons provide context for evaluating performance and setting realistic improvement goals.
Industry Benchmark: Standard for performance comparison
Efficiency Gap: Difference from industry average
Cost Comparison: Evaluating expenses against standards
• Compare to industry averages
• Quantify efficiency gaps
• Set realistic improvement targets
• Research industry benchmarks
• Quantify the cost impact
• Focus on high-impact areas
• Not comparing to industry standards
• Ignoring market conditions
• Setting inappropriate benchmarks
Which operating expense ratio indicates the best operational efficiency?
The answer is D) 25%. The operating expense ratio measures the percentage of revenue consumed by operating expenses. A lower ratio indicates better operational efficiency because less revenue is needed to cover operational costs, leaving more revenue available for profit and growth. Therefore, 25% is the most efficient among the options.
Students must understand that operating expense ratios work inversely - lower is better. A 25% ratio means only 25 cents of every dollar of revenue goes to operating expenses, leaving 75 cents for profit and growth. In contrast, a 55% ratio means 55 cents of every dollar goes to operating expenses, leaving only 45 cents for profit and growth. This fundamental concept is crucial for interpreting efficiency metrics.
Operational Efficiency: How effectively resources are used
Cost Management: Controlling and optimizing expenses
Ratio Interpretation: Understanding what values mean
• Lower ratios = better efficiency
• Compare to industry benchmarks
• Context matters for interpretation
• Remember: Lower ratios = better
• Consider industry context
• Look for trends over time
• Assuming higher ratios are better
• Not considering industry differences
• Ignoring quality implications
FAQ
Q: What's a good operating expense ratio for my business?
A: Good operating expense ratios vary by industry:
- SaaS/Technology: 15-25%
- Retail: 25-30%
- Manufacturing: 20-35%
- Restaurants: 30-35%
Mathematically, if your operating expenses are \( E \) and revenue is \( R \), then:
\( \text{Operating Expense Ratio} = \left(\frac{E}{R}\right) \times 100 \)
For example, with \( E = \$150{,}000 \) and \( R = \$500{,}000 \):
\( \text{Operating Expense Ratio} = \left(\frac{150{,}000}{500{,}000}\right) \times 100 = 30\% \)
This 30% would be good for retail but high for SaaS.
Q: How does operating expense ratio differ from operating margin?
A: The operating expense ratio measures expense consumption, while operating margin measures profitability:
Operating Expense Ratio = (Operating Expenses ÷ Revenue) × 100
Operating Margin = (Operating Income ÷ Revenue) × 100
For example, with Revenue = \( \$500{,}000 \), COGS = \( \$300{,}000 \), Operating Expenses = \( \$125{,}000 \):
- Operating Expense Ratio = (\( \$125{,}000 ÷ \$500{,}000 \)) × 100 = 25%
- Operating Income = \( \$500{,}000 - \$300{,}000 - \$125{,}000 = \$75{,}000 \)
- Operating Margin = (\( \$75{,}000 ÷ \$500{,}000 \)) × 100 = 15%
The expense ratio shows cost efficiency, while the margin shows profit efficiency.