Profit Margin Calculator
Business profitability analysis • 2026 data
Profit Margin Formulas:
Show the calculatorGross Profit Margin: \( GPM = \frac{Revenue - COGS}{Revenue} \times 100 \)
Net Profit Margin: \( NPM = \frac{Revenue - Total\ Expenses}{Revenue} \times 100 \)
Operating Margin: \( OM = \frac{Operating\ Income}{Revenue} \times 100 \)
Where:
- \( Revenue \) = Total sales
- \( COGS \) = Cost of Goods Sold
- \( Total\ Expenses \) = COGS + Operating expenses + Taxes
- \( Operating\ Income \) = Revenue - Operating expenses
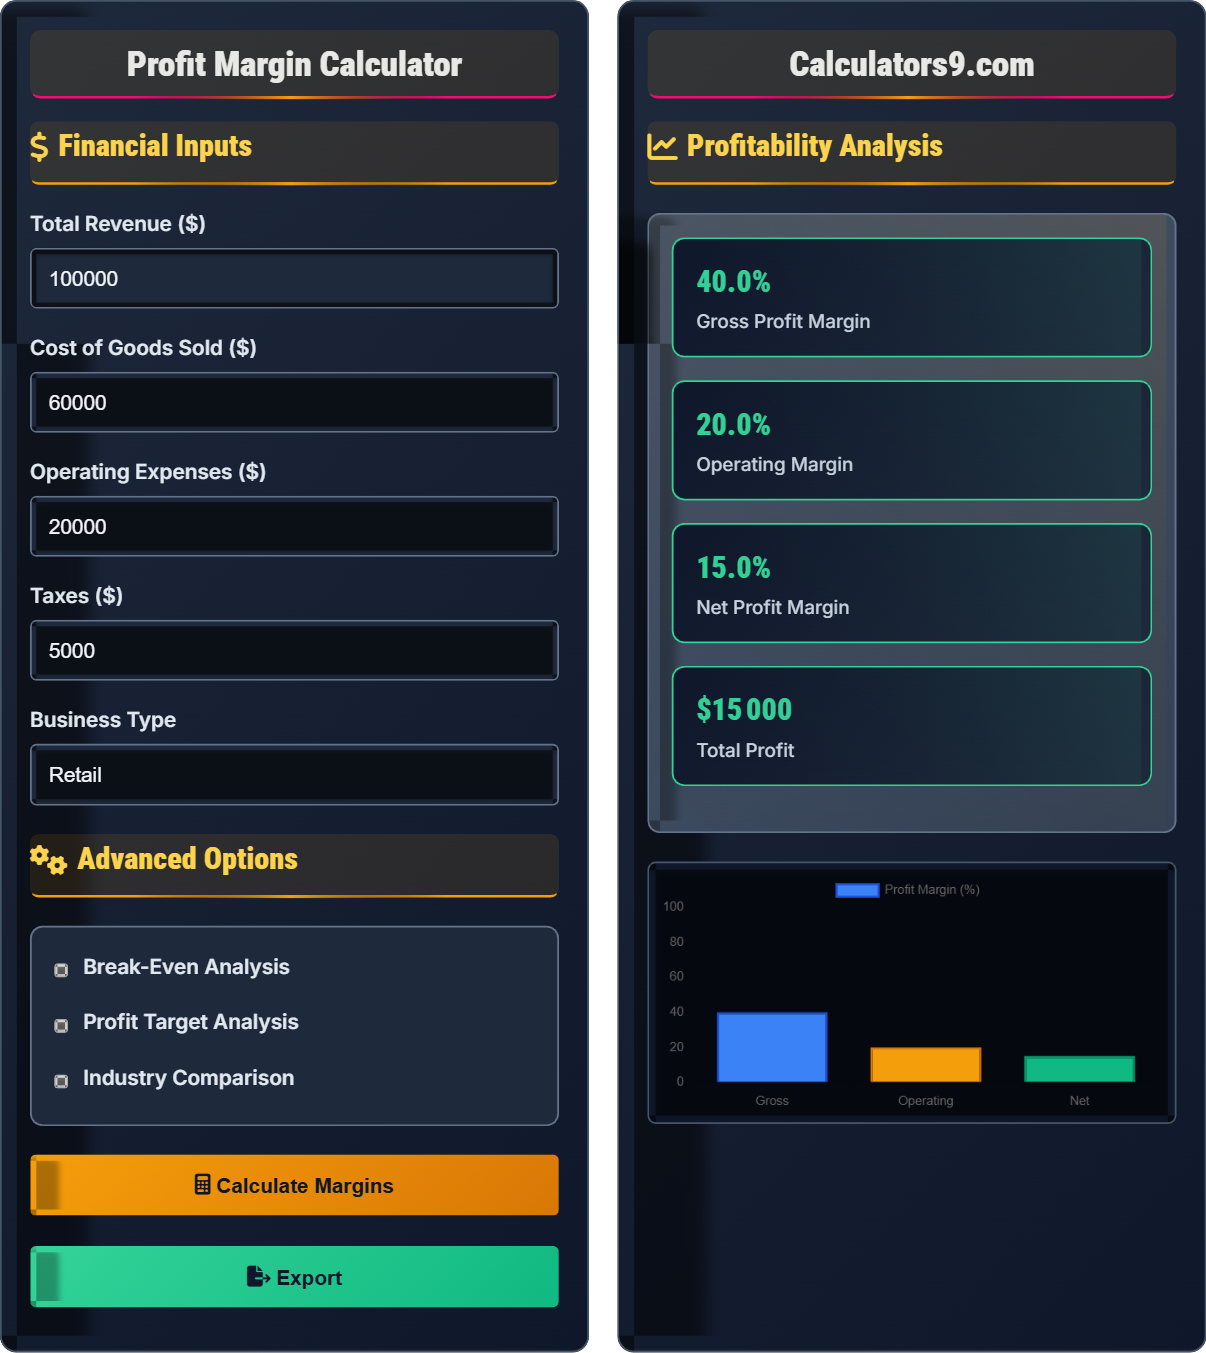
Example: For revenue of $100,000, COGS of $60,000, operating expenses of $20,000:
Gross Profit Margin = \( \frac{100000 - 60000}{100000} \times 100 = 40\% \)
Operating Income = $100,000 - $60,000 - $20,000 = $20,000
Operating Margin = \( \frac{20000}{100000} \times 100 = 20\% \)
Therefore, gross margin is 40% and operating margin is 20%.
Financial Inputs
Advanced Options
Profitability Analysis
| Margin Type | Formula | Calculation | Result |
|---|
| Item | Amount | Percentage |
|---|
Comprehensive Profit Margin Guide
Profit margins measure a company's profitability by comparing profits to revenue. Higher margins indicate better efficiency and profitability. Understanding different types of margins helps assess business performance.
Three key profit margins to track:
Typical profit margins across industries:
- Retail: 4-8% net margin
- Service: 15-25% net margin
- Manufacturing: 8-15% net margin
- Software: 20-30% net margin
- Restaurant: 3-9% net margin
- Consulting: 20-30% net margin
- Increase Revenue: Raise prices, increase sales volume
- Reduce COGS: Negotiate better supplier terms, improve efficiency
- Control Expenses: Cut unnecessary costs, optimize operations
- Improve Productivity: Automate processes, enhance workforce efficiency
- Optimize Mix: Focus on higher-margin products/services
Profit Margin Basics
Percentage of revenue remaining as profit.
\( GPM = \frac{R - COGS}{R} \times 100 \)
\( NPM = \frac{R - TE}{R} \times 100 \)
Where R=revenue, COGS=cost of goods sold, TE=total expenses.
- Higher margins indicate better profitability
- Industry benchmarks vary significantly
- Track margins over time
Strategies
Maximize profitability with strategic improvements.
- Analyze current margins
- Identify improvement opportunities
- Implement cost controls
- Monitor progress regularly
- Quality vs. cost trade-offs
- Market competitiveness
- Customer value perception
- Sustainable growth
Profit Margin Learning Quiz
What does gross profit margin measure?
The answer is B) Profit after cost of goods sold. Gross profit margin measures profitability after subtracting the cost of goods sold (COGS) from revenue. It indicates production efficiency and pricing strategy effectiveness.
Gross margin focuses on the core business activity - producing and selling goods. It excludes operating expenses, taxes, and other non-production costs. This metric helps assess the efficiency of production and procurement processes.
COGS: Cost of Goods Sold - direct costs of production
Production Efficiency: How effectively resources are used
Pricing Strategy: Approach to setting product prices
• Gross margin = (Revenue - COGS) / Revenue
• Excludes operating expenses
• Measures production profitability
• Focus on COGS for gross margin
• Compare to industry benchmarks
• Track trends over time
• Including operating expenses in gross margin
• Confusing gross and net margins
• Not considering industry norms
Calculate the gross profit margin for a business with $200,000 revenue and $120,000 COGS. Show your work.
Using the gross margin formula: GPM = (R - COGS) / R × 100
Where:
- R = $200,000 (revenue)
- COGS = $120,000 (cost of goods sold)
Step 1: Calculate gross profit = $200,000 - $120,000 = $80,000
Step 2: Calculate margin = $80,000 / $200,000 = 0.4
Step 3: Convert to percentage = 0.4 × 100 = 40%
Therefore, the gross profit margin is 40%.
This calculation demonstrates the basic method for determining gross margin. The result shows that 40% of revenue remains after accounting for direct production costs, which can then cover operating expenses and generate profit.
Gross Profit: Revenue minus cost of goods sold
Production Costs: Direct costs of manufacturing products
Revenue: Total sales amount
• Subtract COGS from revenue first
• Divide by revenue
• Multiply by 100 for percentage
• Always use same time period for both values
• Check units (dollars, thousands, etc.)
• Round to appropriate decimal places
• Dividing by COGS instead of revenue
• Forgetting to multiply by 100
• Using different time periods
Sarah's business has $150,000 revenue, $80,000 COGS, $40,000 operating expenses, and $5,000 taxes. If she reduces operating expenses by $10,000, what is the new net profit margin?
Original Net Income:
Revenue = $150,000
Total Expenses = $80,000 (COGS) + $40,000 (Operating) + $5,000 (Taxes) = $125,000
Net Income = $150,000 - $125,000 = $25,000
Original Net Margin = $25,000 / $150,000 × 100 = 16.67%
New Net Income (with $10,000 expense reduction):
New Total Expenses = $80,000 + $30,000 + $5,000 = $115,000
New Net Income = $150,000 - $115,000 = $35,000
New Net Margin = $35,000 / $150,000 × 100 = 23.33%
The new net profit margin is 23.33%.
This example shows how reducing expenses directly improves net profit margin. By cutting $10,000 in operating expenses, the net margin increased from 16.67% to 23.33% - a 6.66 percentage point improvement. This demonstrates the leverage effect of expense control.
Net Income: Revenue minus all expenses
Expense Control: Managing and reducing business costs
Leverage Effect: Small changes in expenses magnify profit impact
• Net income = Revenue - All expenses
• Expense reductions increase margins
• Track both absolute and percentage changes
• Focus on high-impact expense categories
• Monitor recurring expenses
• Consider automation for cost reduction
• Forgetting to include all expense types
• Not considering tax implications
• Ignoring indirect cost savings
Mike's business has $50,000 fixed costs, variable costs of $30,000 for $100,000 in sales. What is the break-even point in sales dollars? What sales volume is needed for a 20% net profit margin?
First, calculate variable cost ratio:
Variable Cost Ratio = Variable Costs / Sales = $30,000 / $100,000 = 0.3 (30%)
Break-Even Point:
BE = Fixed Costs / (1 - Variable Cost Ratio) = $50,000 / (1 - 0.3) = $50,000 / 0.7 = $71,429
For 20% Net Profit Margin:
Required Sales = Fixed Costs / (1 - Variable Cost Ratio - Target Margin)
Required Sales = $50,000 / (1 - 0.3 - 0.2) = $50,000 / 0.5 = $100,000
Mike needs $71,429 to break even and $100,000 for 20% margin.
Break-even analysis helps determine the sales level needed to cover all costs. The formula accounts for both fixed and variable costs. Achieving target margins requires sales above break-even to generate the desired profit percentage.
Fixed Costs: Costs that don't change with sales volume
Variable Costs: Costs that change with sales volume
Break-Even Point: Sales level where revenues equal total costs
• BE = Fixed Costs / (1 - Variable Cost Ratio)
• Variable costs change with volume
• Fixed costs remain constant
• Calculate variable cost ratio first
• Use break-even as minimum target
• Plan for profit margins above break-even
• Confusing fixed and variable costs
• Forgetting to include all fixed costs
• Not adjusting for target margins
Which industry typically has the highest net profit margins?
The answer is B) Software. Software companies typically have 20-30% net profit margins due to high margins on digital products, low marginal costs, and scalable business models. Retail (4-8%), restaurants (3-9%), and manufacturing (8-15%) have lower margins.
Industry margins vary based on business model characteristics. Software companies benefit from high upfront development costs with low ongoing production costs, creating excellent scalability. Physical products and service businesses face higher ongoing costs.
Industry Benchmarks: Average performance metrics by sector
Scalability: Ability to grow without proportional cost increases
Business Model: How a company creates and delivers value
• Compare margins to industry peers
• Consider business model differences
• Factor in competitive dynamics
• Use industry-specific benchmarks
• Consider business model when comparing
• Track relative performance
• Comparing across dissimilar industries
• Not considering business model differences
• Ignoring market conditions
FAQ
Q: How do I calculate profit margins for my business?
A: Use these formulas:
Gross Margin: \( \frac{Revenue - COGS}{Revenue} \times 100 \)
Net Margin: \( \frac{Revenue - Total\ Expenses}{Revenue} \times 100 \)
For $100,000 revenue, $60,000 COGS, $20,000 operating expenses, $5,000 taxes:
Gross Margin = \( \frac{100000 - 60000}{100000} \times 100 = 40\% \)
Net Margin = \( \frac{100000 - 85000}{100000} \times 100 = 15\% \)
Track margins monthly to monitor business health.
Q: What's the difference between gross and net margins?
A: The differences are:
- Gross Margin: Revenue minus Cost of Goods Sold (COGS)
- Operating Margin: Gross profit minus operating expenses
- Net Margin: Operating income minus taxes and interest
For a business with $100,000 revenue, $60,000 COGS, $20,000 operating expenses, $5,000 taxes:
- Gross Margin: 40%
- Operating Margin: 20%
- Net Margin: 15%
Each level reveals different aspects of business efficiency.