Quick Ratio Calculator
Liquidity analysis • 2026 best practices
Quick Ratio Formula:
Show the calculator\( \text{Quick Ratio} = \frac{\text{Cash + Marketable Securities + Accounts Receivable}}{\text{Current Liabilities}} \)
Where:
- \( \text{Quick Assets} \) = Cash, cash equivalents, marketable securities, and receivables
- \( \text{Current Liabilities} \) = Obligations due within one year
- \( \text{Ratio} \) = Ability to meet short-term obligations without inventory
The quick ratio, also known as the acid-test ratio, measures immediate liquidity without relying on inventory sales. A ratio of 1.0 or higher indicates sufficient liquid assets to cover current liabilities. Conservative benchmarks: 1.0-2.0. Ratios below 1.0 may indicate liquidity concerns.
Example: For a company with $50,000 cash, $20,000 receivables, and $40,000 current liabilities:
Quick Ratio = ($50,000 + $20,000) ÷ $40,000 = 1.75
This 1.75 ratio indicates strong liquidity, with $1.75 in liquid assets for every $1.00 in current liabilities.
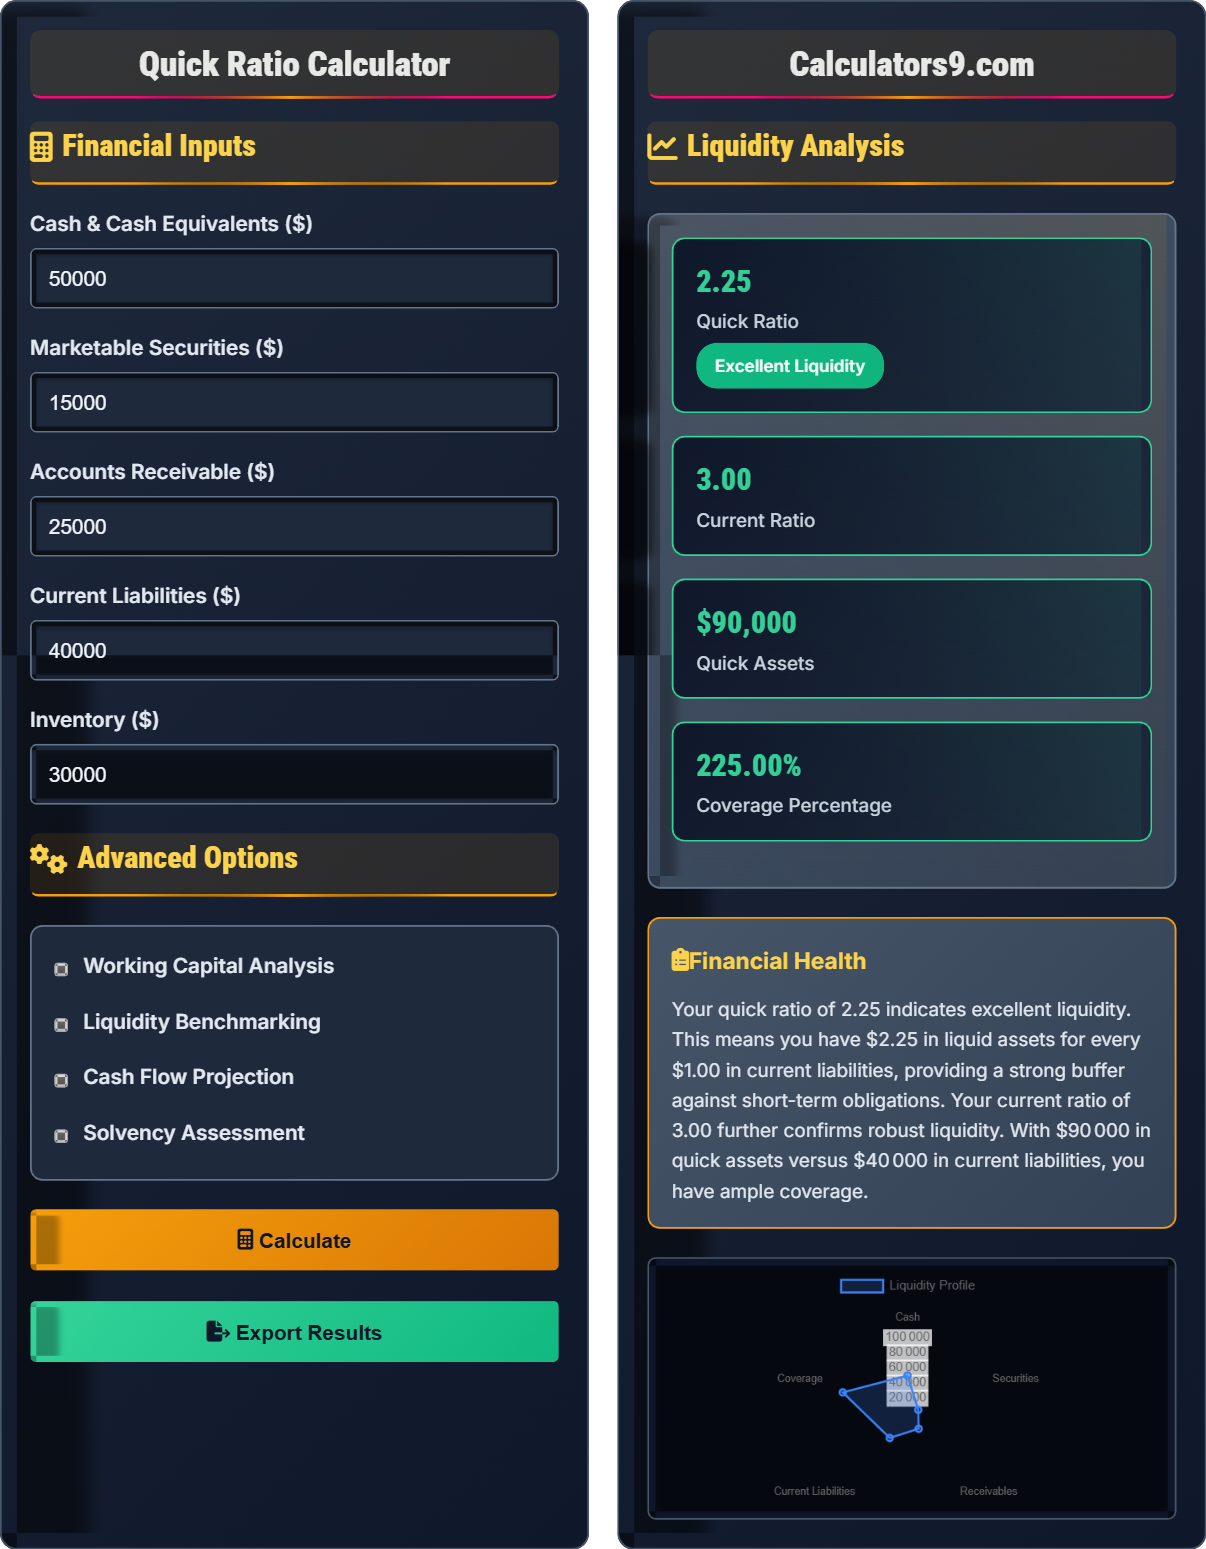
Financial Inputs
Advanced Options
Liquidity Analysis
| Ratio | Value | Industry Benchmark | Status |
|---|
| Asset Type | Amount | % of Total | Liquid? |
|---|
Comprehensive Liquidity Guide
The quick ratio (acid-test ratio) measures a company's ability to meet its short-term obligations with its most liquid assets. Unlike the current ratio, it excludes inventory, providing a more conservative measure of liquidity. This ratio is crucial for assessing immediate financial health and the ability to pay current liabilities without relying on inventory sales.
Key ratios for liquidity analysis:
Current Ratio: Current Assets ÷ Current Liabilities
Cash Ratio: Cash ÷ Current Liabilities
These metrics help evaluate business financial health and compare against industry standards.
Typical quick ratios by industry:
- Technology: 1.5-2.5 (high cash reserves)
- Retail: 0.5-1.0 (inventory heavy)
- Manufacturing: 1.0-1.5 (mixed asset structure)
- Services: 1.2-2.0 (low inventory)
- Banking: 0.1-0.5 (different asset structure)
- Monitor ratios monthly to identify trends
- Compare to industry benchmarks for context
- Prepare for seasonal variations in liquidity
- Maintain cash reserves for unexpected obligations
- Optimize receivables management for liquidity
Liquidity Fundamentals
Measure of immediate liquidity excluding inventory (cash + receivables ÷ current liabilities).
Quick Ratio = (Cash + Marketable Securities + Accounts Receivable) ÷ Current Liabilities
Excludes inventory for more conservative liquidity assessment.
- Ratio of 1.0+ indicates sufficient liquidity
- Benchmarks vary by industry
- More conservative than current ratio
Ratio Interpretation
Above 1.5 = Excellent, 1.0-1.5 = Good, 0.8-1.0 = Average, Below 0.8 = Concerning.
- Accelerate receivables collection
- Optimize cash management
- Reduce unnecessary expenses
- Renegotiate payment terms
- Seasonal variations affect ratios
- Industry structure impacts benchmarks
- Quality of receivables matters
- Market conditions influence liquidity
Liquidity Analysis Learning Quiz
Which of the following is included in the calculation of the quick ratio?
The answer is B) Accounts Receivable. The quick ratio includes only the most liquid assets: cash, marketable securities, and accounts receivable. Inventory is excluded because it's not immediately convertible to cash, making the quick ratio more conservative than the current ratio.
Students must understand that the quick ratio is designed to measure immediate liquidity without relying on inventory sales. This makes it a more stringent test of liquidity than the current ratio. The exclusion of inventory is crucial because inventory conversion to cash can take time and may involve losses if sold quickly.
Quick Ratio: Liquidity measure excluding inventory
Liquid Assets: Assets easily converted to cash
Current Liabilities: Obligations due within one year
• Quick ratio excludes inventory
• Includes cash and receivables
• More conservative than current ratio
• Remember: Quick ratio excludes inventory
• Liquid assets = cash + receivables
• More conservative than current ratio
• Including inventory in quick ratio
• Confusing quick with current ratio
• Misunderstanding asset liquidity
Calculate the quick ratio for a company with $30,000 cash, $10,000 marketable securities, $20,000 accounts receivable, and $40,000 current liabilities. Show your work.
Step 1: Calculate quick assets
Quick Assets = Cash + Marketable Securities + Accounts Receivable
Quick Assets = $30,000 + $10,000 + $20,000 = $60,000
Step 2: Apply the quick ratio formula
Quick Ratio = Quick Assets ÷ Current Liabilities
Quick Ratio = $60,000 ÷ $40,000 = 1.5
Step 3: Interpret the result
This means the company has $1.50 in liquid assets for every $1.00 in current liabilities, indicating good liquidity.
Therefore, the quick ratio is 1.5.
This calculation demonstrates the fundamental formula for the quick ratio. A ratio of 1.5 indicates that for every dollar of current liabilities, the company has $1.50 in highly liquid assets. This provides a comfortable buffer against short-term obligations. The calculation excludes inventory, which is not immediately convertible to cash.
Quick Assets: Most liquid current assets (excluding inventory)
Liquidity Ratio: Measure of ability to meet short-term obligations
Financial Health: Ability to meet obligations
• Quick Ratio = (Cash + Securities + Receivables) ÷ Liabilities
• Exclude inventory from calculation
• Ratio of 1.0+ indicates adequate liquidity
• Calculate quick assets first
• Divide by current liabilities
• Compare to industry benchmarks
• Including inventory in quick assets
• Forgetting to add all liquid assets
• Dividing by wrong denominator
A company has a quick ratio of 0.75, which is below the industry benchmark of 1.0. They have $25,000 in quick assets and $35,000 in current liabilities. How much in additional cash would they need to achieve the benchmark ratio of 1.0?
Step 1: Verify current quick ratio
Current Quick Ratio = $25,000 ÷ $35,000 = 0.71 (approximately)
Step 2: Calculate required quick assets for 1.0 ratio
Required Quick Assets = Current Liabilities × Target Ratio
Required Quick Assets = $35,000 × 1.0 = $35,000
Step 3: Calculate additional cash needed
Additional Cash Needed = Required Quick Assets - Current Quick Assets
Additional Cash Needed = $35,000 - $25,000 = $10,000
Step 4: Verify new ratio
New Quick Ratio = ($25,000 + $10,000) ÷ $35,000 = 1.0
Therefore, the company needs $10,000 in additional cash to achieve the benchmark ratio.
This problem demonstrates how to use the quick ratio for planning and goal-setting. By working backwards from the target ratio, we can determine the specific asset level needed. This approach helps in setting realistic targets and identifying concrete improvement opportunities. The $10,000 represents the minimum additional liquid assets needed to meet the benchmark.
Target Ratio: Desired liquidity percentage
Liquidity Planning: Setting and achieving financial goals
Asset Management: Controlling liquid resources
• Work backwards from target ratio
• Quick Assets = Liabilities × Ratio
• Solve for required assets
• Calculate required assets first
• Determine the difference needed
• Verify the new ratio
• Setting unrealistic targets
• Not considering implementation feasibility
• Forgetting to verify calculations
A retail company has a quick ratio of 0.6 while the industry average is 0.8. The company has $100,000 in current liabilities. What does this indicate about their liquidity position, and how much more in liquid assets do they need to reach the industry average?
Current Situation:
Current Quick Assets = $100,000 × 0.6 = $60,000
Required Quick Assets = $100,000 × 0.8 = $80,000
Deficit = $80,000 - $60,000 = $20,000
Analysis:
The company's 0.6 ratio is 0.2 points lower than the industry average of 0.8, indicating weaker liquidity. They have $20,000 less in liquid assets than the industry average for the same liability level. This suggests potential challenges meeting short-term obligations.
Recommendations:
- Accelerate receivables collection
- Improve cash management
- Optimize inventory levels
- Consider short-term financing
This problem demonstrates the importance of industry benchmarking. The 0.2 point difference may seem small, but it represents $20,000 in additional liquid assets needed for a $100,000 liability company. This quantifies the liquidity gap and provides a concrete target for improvement. Industry comparisons provide context for evaluating financial health.
Industry Benchmark: Standard for performance comparison
Liquidity Gap: Difference from industry average
Financial Health: Ability to meet obligations
• Compare to industry averages
• Quantify the liquidity gap
• Set realistic improvement targets
• Research industry benchmarks
• Quantify the financial impact
• Focus on high-impact improvements
• Not comparing to industry standards
• Ignoring market conditions
• Setting inappropriate benchmarks
Which quick ratio indicates the strongest liquidity position?
The answer is D) 2.0. The quick ratio measures liquidity by comparing liquid assets to current liabilities. A higher ratio indicates more liquid assets relative to obligations. A ratio of 2.0 means the company has $2.00 in liquid assets for every $1.00 in current liabilities, providing the strongest buffer against short-term obligations among the options.
Students must understand that quick ratios work directly - higher is better. A 2.0 ratio means for every dollar of current liabilities, there are two dollars of liquid assets available, providing excellent protection. In contrast, a 0.5 ratio means only 50 cents of liquid assets for every dollar of liabilities, indicating potential liquidity problems. This fundamental concept is crucial for interpreting financial health.
Liquidity Position: Ability to meet short-term obligations
Financial Health: Overall financial condition
Ratio Interpretation: Understanding what values mean
• Higher ratios = better liquidity
• Compare to industry benchmarks
• Context matters for interpretation
• Remember: Higher ratios = better
• Consider industry context
• Look for trends over time
• Assuming lower ratios are better
• Not considering industry differences
• Ignoring quality of liquid assets
FAQ
Q: What's a good quick ratio for my business?
A: Good quick ratios vary by industry:
- Technology: 1.5-2.5 (high cash reserves)
- Retail: 0.5-1.0 (inventory heavy)
- Manufacturing: 1.0-1.5 (mixed asset structure)
- Services: 1.2-2.0 (low inventory)
Mathematically, if your quick assets are \( QA \) and current liabilities are \( CL \), then:
\( \text{Quick Ratio} = \frac{QA}{CL} \)
For example, with \( QA = \$60{,}000 \) and \( CL = \$40{,}000 \):
\( \text{Quick Ratio} = \frac{60{,}000}{40{,}000} = 1.5 \)
This 1.5 would be good for most industries, especially services.
Q: How does quick ratio differ from current ratio?
A: The quick ratio excludes inventory while the current ratio includes all current assets:
Quick Ratio = (Cash + Securities + Receivables) ÷ Current Liabilities
Current Ratio = Current Assets ÷ Current Liabilities
For example, with Cash = \( \$30{,}000 \), Receivables = \( \$20{,}000 \), Inventory = \( \$25{,}000 \), and Current Liabilities = \( \$40{,}000 \):
- Quick Ratio = (\( \$30{,}000 + \$20{,}000 \)) ÷ \( \$40{,}000 \) = 1.25
- Current Ratio = (\( \$30{,}000 + \$20{,}000 + \$25{,}000 \)) ÷ \( \$40{,}000 \) = 1.875
The quick ratio provides a more conservative liquidity assessment.