Market Cap Estimator
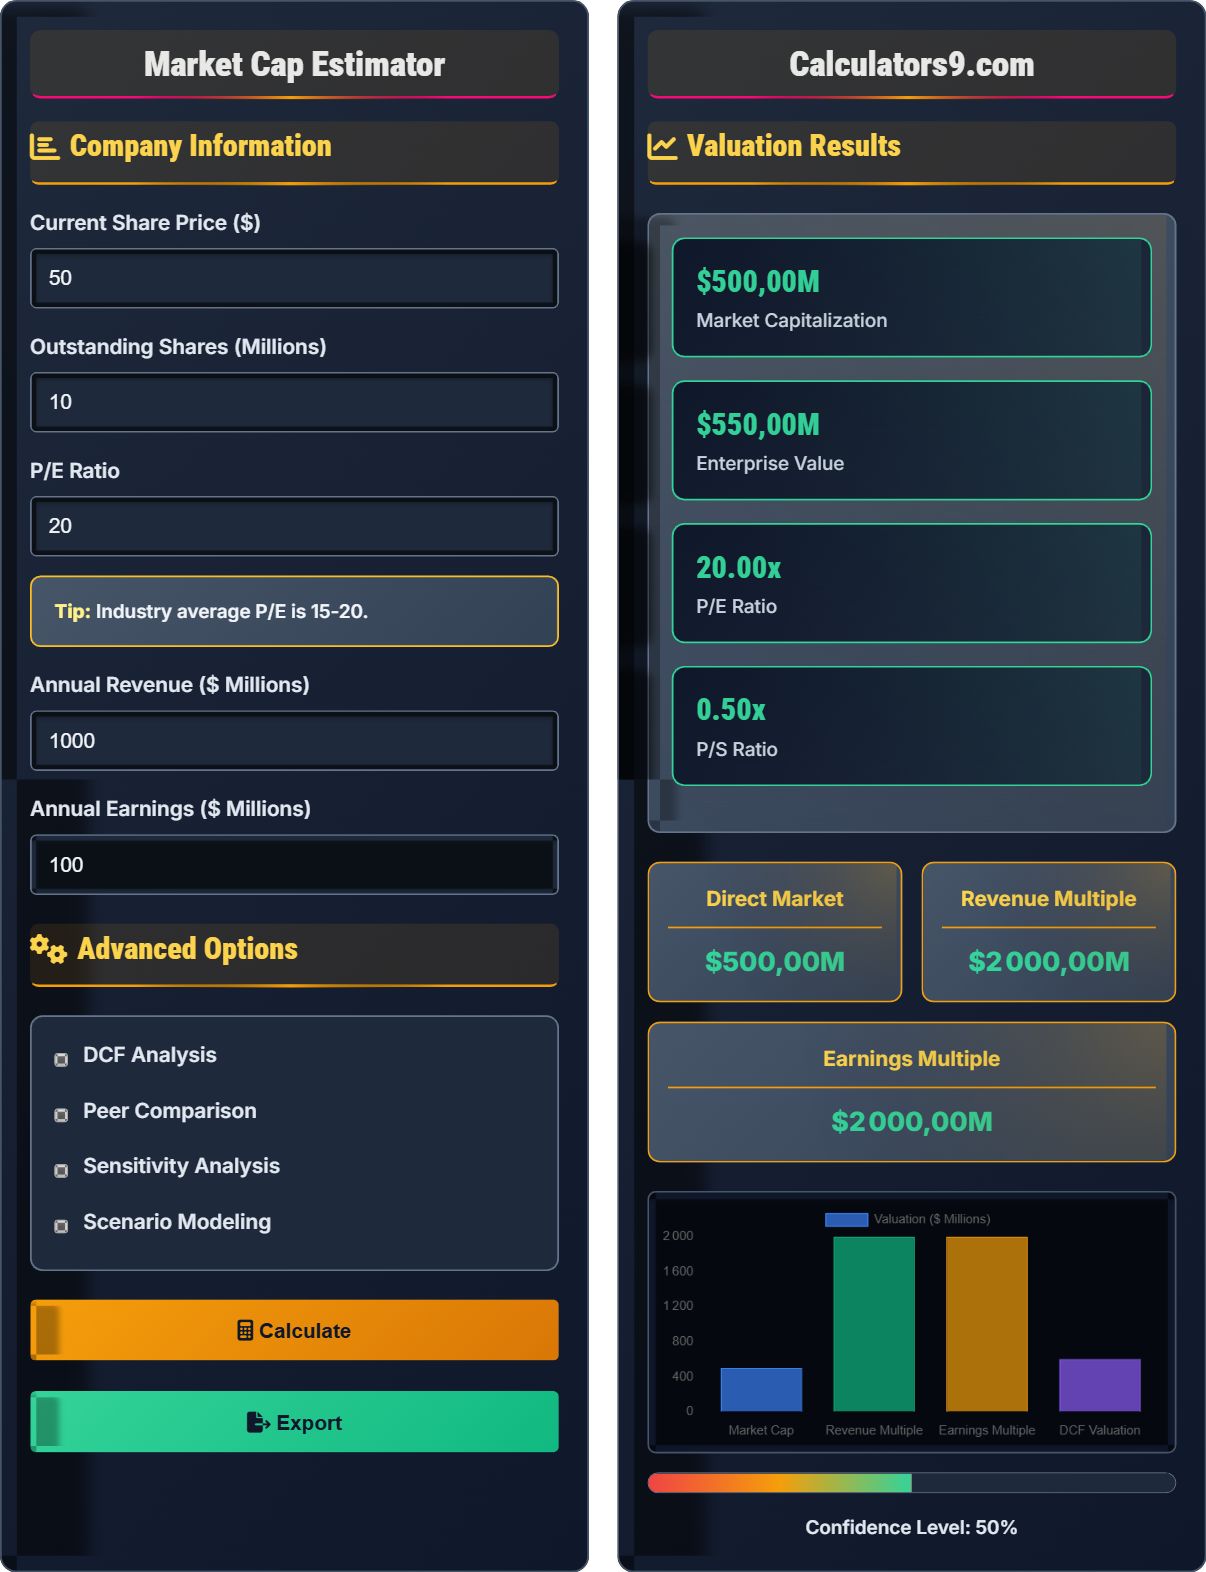
Company valuation calculator • 2026 markets
Market Cap Formula:
Show the calculatorMarket Cap = Share Price × Outstanding Shares
Where:
- Share Price = Current market price per share
- Outstanding Shares = Total number of shares available to investors
This formula calculates the total market value of a company's equity. It's the most common method for determining a company's size and value in the stock market.
Example: If a company has 10 million outstanding shares trading at $50 per share:
Market Cap = $50 × 10,000,000 = $500,000,000
Thus, the company's market capitalization is $500 million.
Company Information
Advanced Options
Valuation Results
Sensitivity Analysis
Comprehensive Market Cap Guide
Market capitalization (market cap) is the total market value of a company's outstanding shares of stock. It represents the theoretical cost of buying all of a company's shares at the current market price. Market cap is the primary measure of a company's size and is used by investors to categorize stocks.
The standard market capitalization calculation uses the following formula:
Where:
- Share Price = Current market price per share
- Outstanding Shares = Total number of shares issued and held by investors
While market cap is the primary valuation metric, other methods provide additional perspectives:
- Enterprise Value (EV): Market cap + debt - cash
- P/E Ratio: Price-to-earnings comparison
- P/B Ratio: Price-to-book value
- DCF Analysis: Discounted cash flow projections
- Comparable Companies: Relative valuation to peers
- Diversification: Mix market caps to balance risk and return
- Index Investing: Target specific market cap indices
- Growth Potential: Smaller caps often have higher growth potential
- Stability: Large caps tend to be more stable during volatility
- Dividends: Larger companies often pay consistent dividends
Market Cap Fundamentals
Total market value of outstanding shares.
Market Cap = Share Price × Outstanding Shares
Where market cap = total equity value, share price = current trading price, shares = total outstanding shares.
- Fluctuates with stock price
- Reflects investor sentiment
- Used for company categorization
Valuation Strategies
Market cap adjusted for debt and cash position.
- Use P/E ratios across sectors
- Consider revenue multiples
- Analyze peer valuations
- Evaluate growth prospects
- Market cap ≠ intrinsic value
- Stock price affects valuation
- Share buybacks impact metrics
- Market conditions influence valuations
Market Cap Learning Quiz
Which market cap category best describes a company with a $15 billion valuation?
The answer is B) Large Cap. According to standard market cap classifications, Large Cap companies have valuations between $10 billion and $200 billion. A $15 billion company falls within this range. Mega Cap is $200+ billion, Mid Cap is $2-10 billion, and Small Cap is $300 million-2 billion.
Understanding market cap categories is essential for portfolio construction and risk assessment. These classifications help investors set expectations for growth potential, volatility, and dividend policies. Large caps typically offer stability and dividends, while smaller caps offer higher growth potential but increased volatility.
Market Cap: Total market value of outstanding shares
Large Cap: Companies valued between $10B-$200B
Portfolio Construction: Building a diversified investment portfolio
• Market cap categories provide standardized company classification
• Each category has distinct risk and return characteristics
• Classification changes as stock prices fluctuate
• Remember: Mega ($200B+), Large ($10B-$200B), Mid ($2B-$10B), Small ($300M-$2B)
• Use mnemonics: "My Large Middle Sister" for Mega/Large/Mid/Small
• Confusing market cap with revenue or assets
• Misclassifying companies near category boundaries
• Forgetting that market cap fluctuates with stock price
If a company has 50 million shares outstanding and trades at $40 per share, what is its market capitalization? Show your work.
Using the market cap formula: Market Cap = Share Price × Outstanding Shares
Given:
- Share Price = $40
- Outstanding Shares = 50,000,000
Step 1: Multiply share price by outstanding shares
Market Cap = $40 × 50,000,000 = $2,000,000,000
Step 2: Convert to millions for easier reading
Market Cap = $2.0 billion
This calculation demonstrates the direct relationship between share price and market cap. Every dollar change in share price affects the total market cap by the number of outstanding shares. This is why large companies with many shares outstanding see significant market cap changes with small price movements.
Outstanding Shares: Total shares held by investors
Market Capitalization: Total market value of equityShare Price: Current trading price per share
• Market cap changes as share price fluctuates
• Outstanding shares exclude treasury stock
• Formula is straightforward but critical for valuation
• Remember: Market Cap = Price × Shares
• Convert to billions for large companies (divide by 1,000,000,000)
• Use scientific notation for very large numbers
• Confusing outstanding shares with authorized shares
• Forgetting to include zeros in large calculations
• Mixing up units (millions vs billions)
Company XYZ has 100 million shares outstanding trading at $25 per share. If the stock price increases by 15% due to positive earnings news, what will be the new market capitalization and how much value has been added?
Step 1: Calculate current market cap = $25 × 100,000,000 = $2,500,000,000
Step 2: Calculate new share price = $25 × 1.15 = $28.75
Step 3: Calculate new market cap = $28.75 × 100,000,000 = $2,875,000,000
Step 4: Calculate value added = $2,875,000,000 - $2,500,000,000 = $375,000,000
Therefore, the new market cap is $2.875 billion, representing $375 million in added value.
This example illustrates how stock price changes directly impact market cap. The 15% price increase resulted in $375 million in additional market value for the company. This demonstrates the sensitivity of market cap to share price movements, especially for companies with many outstanding shares.
Market Value Added: Increase in market capitalization
Price Sensitivity: How market cap responds to price changes
Earnings News: Financial results affecting stock price
• Market cap changes proportionally with share price
• More shares outstanding mean greater sensitivity to price changes
• Positive news can significantly increase market value
• Value added = Change in price × Outstanding shares
• Percentage change in price equals percentage change in market cap
• Use this calculation to estimate impact of expected price changes
• Calculating percentage change incorrectly
• Forgetting to keep shares constant when calculating new market cap
• Confusing dollar value added with percentage change
You're analyzing three companies in the same industry: Company A (Market Cap: $5B), Company B (Market Cap: $15B), and Company C (Market Cap: $25B). If the industry average P/E ratio is 18x, which company appears potentially undervalued based on market cap alone? (Assume similar fundamentals)
Step 1: At the same P/E ratio, market cap reflects earnings scale
Step 2: Higher market cap indicates larger earnings base
Step 3: If fundamentals are similar, differences in market cap suggest valuation differences
Step 4: Company A at $5B might be undervalued if it has similar growth prospects to the larger companies
Step 5: However, size premiums and risk factors also influence market cap
Therefore, Company A appears potentially undervalued, but further analysis of fundamentals is needed.
This demonstrates the importance of context in market cap analysis. While Company A has the lowest market cap, it might represent a value opportunity if it has similar growth prospects to larger peers. However, market cap differences often reflect fundamental differences like risk, growth potential, or business model efficiency. Always consider underlying fundamentals when comparing market caps.
Peer Comparison: Comparing similar companies in valuation
Undervaluation: Market price below intrinsic value
Fundamentals: Financial and operational metrics
• Market cap alone doesn't indicate valuation
• Compare companies within the same industry and risk profile
• Consider fundamentals beyond market cap
• Use multiple valuation metrics together
• Consider P/E, P/B, EV/EBITDA ratios alongside market cap
• Look for catalysts that might close valuation gaps
• Assuming lower market cap always means undervaluation
• Not considering fundamental differences between companies
• Ignoring industry-specific factors affecting valuation
Which of the following events would cause a company's market capitalization to decrease, assuming all other factors remain constant?
The answer is D) Stock price decline. Market capitalization is calculated as Share Price × Outstanding Shares. A decline in stock price directly reduces market cap. Share buybacks reduce outstanding shares but don't necessarily reduce market cap. Stock splits adjust the share count and price proportionally, leaving market cap unchanged. Dividend increases don't directly affect market cap calculations.
This question tests understanding of what affects market capitalization. Only changes in share price or outstanding shares affect market cap. Corporate actions like stock splits and dividends don't change the total market value of the company. Share buybacks can increase per-share metrics but reduce outstanding shares, which may or may not affect total market cap depending on market reaction.
Share Buyback: Company repurchases its own shares
Stock Split: Increases shares outstanding proportionally
Market Value: Total equity value in the market
• Market cap = Share price × Outstanding shares only
• Corporate actions may affect perception but not calculation
• Stock splits don't change market cap
• Remember: Only price and share count affect market cap
• Corporate actions often have indirect market effects
• Focus on the mathematical definition
• Confusing market cap with enterprise value
• Thinking corporate actions directly change market cap
• Forgetting that stock splits preserve market value
FAQ
Q: What's the difference between market cap and enterprise value?
A: Market capitalization measures only the equity value of a company, while enterprise value (EV) provides a more comprehensive view of total company value including debt and cash.
Market Cap Formula: \( \text{Market Cap} = \text{Share Price} \times \text{Outstanding Shares} \)
Enterprise Value Formula: \( \text{EV} = \text{Market Cap} + \text{Total Debt} - \text{Cash & Equivalents} \)
For example, if a company has a market cap of $500 million, $100 million in debt, and $50 million in cash:
\( \text{EV} = 500 + 100 - 50 = 550 \) million
Enterprise value is preferred for acquisition analysis because it represents the total cost of acquiring 100% of the company, including assumption of debt and receipt of cash.
Q: How reliable is market cap as an indicator of company value?
A: Market cap is a useful but imperfect indicator of company value. It reflects investor sentiment and market pricing, but not necessarily intrinsic value.
Advantages of market cap:
- Easy to calculate and understand
- Reflects real-time market consensus
- Useful for company categorization and benchmarking
Limits of market cap:
- Subject to market volatility and sentiment
- Doesn't account for debt or cash positions
- May not reflect true economic value
Smart investors use market cap alongside other metrics like price-to-earnings, price-to-book, and discounted cash flow analysis for a more complete picture of company value.