P/E Ratio Evaluator
Stock valuation analysis • 2026 data
P/E Ratio Formula:
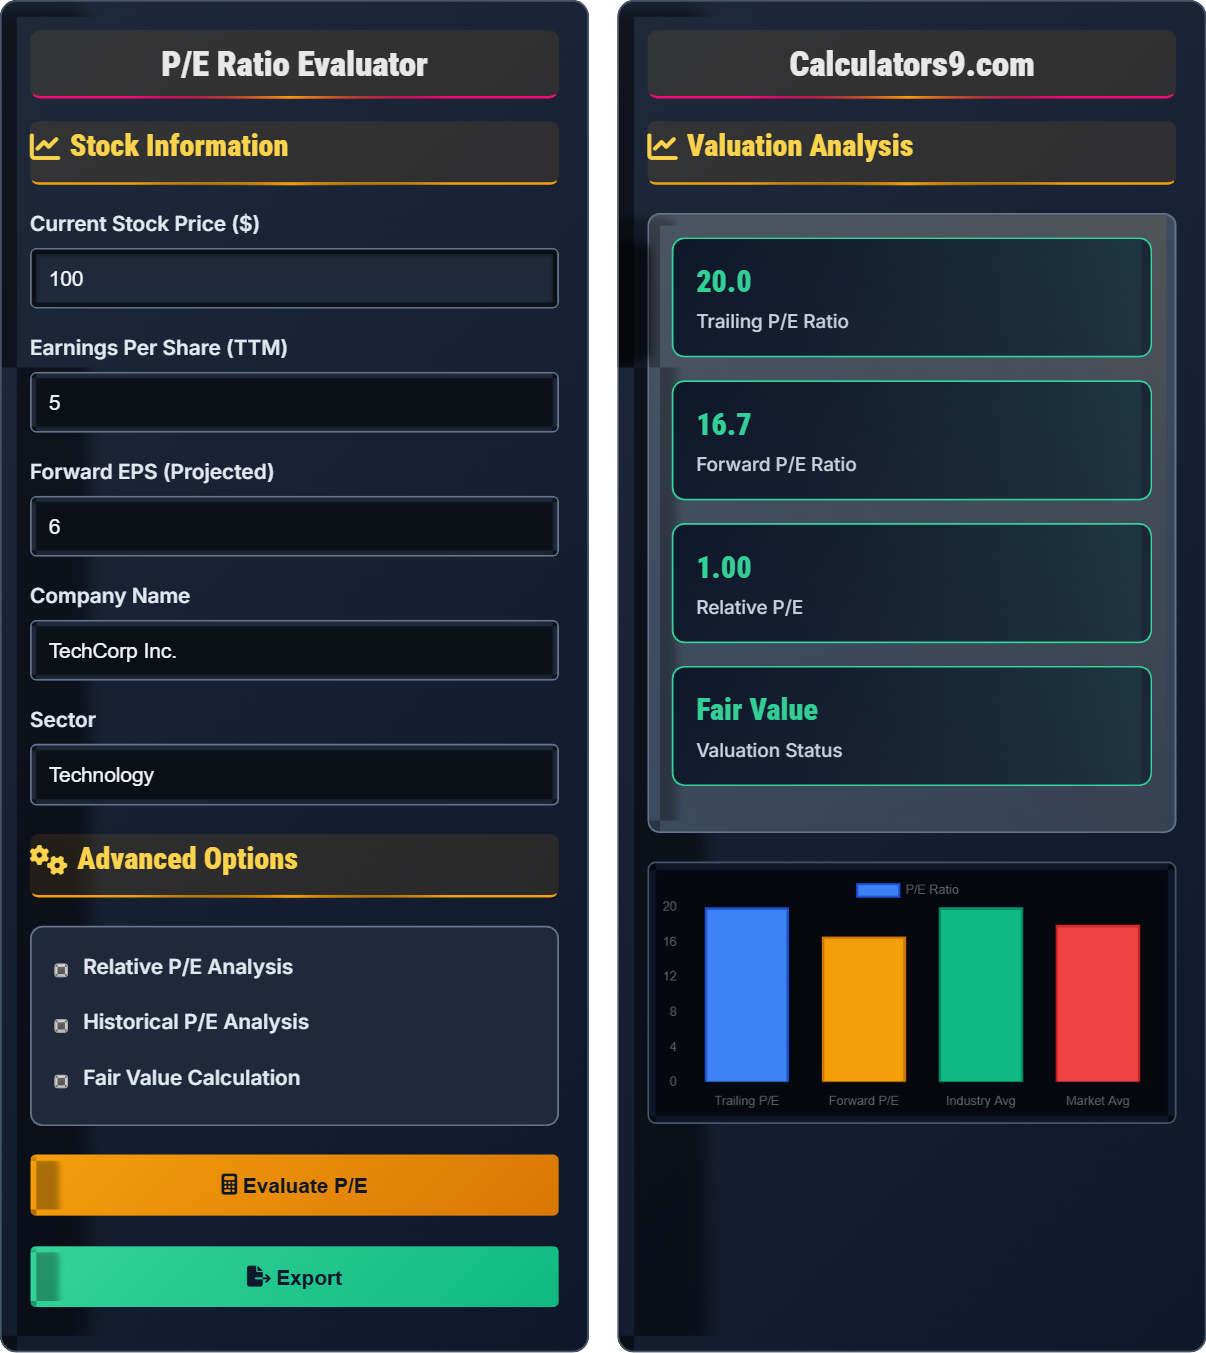
Show the calculatorTrailing P/E: \( P/E = \frac{Current\ Price}{EPS_{TTM}} \)
Forward P/E: \( P/E = \frac{Current\ Price}{EPS_{Forward}} \)
Relative P/E: \( P/E_{Relative} = \frac{Stock\ P/E}{Industry\ P/E} \)
Where:
- \( P/E \) = Price-to-Earnings Ratio
- \( Current\ Price \) = Current stock price
- \( EPS_{TTM} \) = Earnings Per Share (Trailing Twelve Months)
- \( EPS_{Forward} \) = Projected Earnings Per Share
Example: For a stock priced at $100 with TTM EPS of $5:
\( P/E = \frac{100}{5} = 20 \)
This means investors pay $20 for every $1 of earnings.
Valuation: P/E < 15 = Undervalued, P/E 15-25 = Fair, P/E > 25 = Overvalued
Stock Information
Advanced Options
Valuation Analysis
| Metric | Value | Interpretation |
|---|
| Factor | Assessment | Recommendation |
|---|
Comprehensive P/E Ratio Guide
The Price-to-Earnings ratio compares a company's stock price to its earnings per share. It indicates how much investors are willing to pay for each dollar of earnings. A higher P/E suggests investors expect higher growth.
Two main P/E ratios used in analysis:
Forward P/E is often preferred as it reflects future expectations.
Typical P/E ranges vary significantly by sector:
- Technology: 20-35 (high growth expectations)
- Healthcare: 15-25 (stable growth)
- Finance: 10-15 (regulated industry)
- Utilities: 12-18 (stable, regulated)
- Consumer Discretionary: 18-28 (cyclical)
- Energy: 10-20 (volatile commodity prices)
- Context Matters: Compare within same industry and growth stage
- Quality Over Quantity: Sustainable earnings are more important than low P/E
- Future Focus: Forward P/E is often more relevant than trailing
- Market Cycles: P/E ratios are cyclical and change over time
- Complementary Analysis: Use P/E alongside other metrics like PEG ratio
P/E Ratio Basics
Ratio of stock price to earnings per share.
\( P/E = \frac{Price}{EPS} \)
Where Price=stock price, EPS=earnings per share.
- Lower P/E may indicate value
- Higher P/E suggests growth expectations
- Compare within same industry
Analysis
Assess stock value using multiple metrics.
- Calculate both trailing and forward P/E
- Compare to industry averages
- Consider historical ranges
- Assess growth prospects
- Market conditions affect P/E
- Seasonal factors matter
- One-time events can distort EPS
- Combine with other metrics
P/E Ratio Learning Quiz
What does a P/E ratio of 20 indicate?
The answer is B) Investors pay $20 for each $1 of earnings. The P/E ratio shows how much investors are willing to pay for each dollar of a company's earnings. A P/E of 20 means the stock price is 20 times the earnings per share.
The P/E ratio is a relative valuation metric. It measures the relationship between market price and earnings. A higher P/E suggests investors expect higher growth or are willing to pay more for each dollar of earnings, while a lower P/E may indicate undervaluation or lower growth expectations.
P/E Ratio: Price-to-Earnings ratio comparing stock price to earnings
Market Expectations: Investor sentiment about future performance
Relative Valuation: Comparing to other similar companies
• P/E = Stock Price ÷ Earnings Per Share
• Higher P/E = Higher growth expectations
• Compare within same industry
• Use forward P/E when available
• Compare to industry averages
• Consider growth prospects
• Confusing P/E with stock price
• Not considering industry context
• Ignoring earnings quality
Calculate the P/E ratio for a stock priced at $80 with earnings per share of $4. Show your work.
Using the P/E formula: P/E = Price ÷ EPS
Where:
- Price = $80 (stock price)
- EPS = $4 (earnings per share)
Step 1: Divide stock price by earnings per share
Step 2: P/E = $80 ÷ $4 = 20
Therefore, the P/E ratio is 20.
This calculation demonstrates the basic P/E ratio formula. The result shows that investors are paying 20 times the annual earnings per share for this stock. This ratio helps compare the relative value of stocks across different companies.
Stock Price: Current market value per share
Earnings Per Share: Company profit per outstanding share
Ratio: Mathematical relationship between two values
• Always divide price by earnings
• Use same time period for both values
• Consider both trailing and forward EPS
• Use trailing twelve months (TTM) data
• Consider forward projections
• Compare to historical averages
• Dividing earnings by price instead
• Using different time periods
• Not considering one-time items
ABC Corp has a current stock price of $60. Its trailing EPS is $3, but analysts expect next year's EPS to be $4. Calculate both trailing and forward P/E ratios. Which is more relevant for valuation?
Trailing P/E Calculation:
P/E = $60 ÷ $3 = 20
Forward P/E Calculation:
P/E = $60 ÷ $4 = 15
The forward P/E of 15 is more relevant for valuation as it reflects expected future earnings, which is what investors are actually paying for. The forward P/E suggests the stock is attractively valued at 15x projected earnings.
This example demonstrates why forward P/E is often preferred in valuation. If a company's earnings are expected to grow, the forward P/E will be lower than the trailing P/E, providing a more accurate picture of current valuation relative to future expectations.
Trailing P/E: Based on past 12 months of earnings
Forward P/E: Based on projected future earnings
Expected Earnings: Analyst forecasts of future performance
• Forward P/E often more relevant than trailing
• Growth expectations affect valuation
• Consider analyst credibility
• Use forward P/E when earnings growth is expected
• Compare both ratios for perspective
• Assess analyst forecast reliability
• Only using trailing P/E
• Not considering growth prospects
• Accepting all analyst forecasts uncritically
Sarah is analyzing TechCo with a P/E of 28. The technology sector average is 24, and the broader market average is 20. Calculate the relative P/E ratios and interpret the results.
Relative P/E to Technology Sector:
Relative P/E = Company P/E ÷ Sector P/E = 28 ÷ 24 = 1.17
Relative P/E to Market:
Relative P/E = 28 ÷ 20 = 1.40
Interpretation: TechCo trades at a 17% premium to its sector average and 40% premium to the market. This suggests investors expect superior growth from TechCo compared to its peers, but it's relatively expensive.
Relative P/E analysis provides context for absolute P/E ratios. By comparing to sector and market averages, investors can determine if a stock's P/E is justified by its growth prospects relative to peers. A relative P/E above 1 indicates premium valuation.
Relative P/E: Company P/E compared to benchmark
Sector Average: Mean P/E of companies in same industry
Market Average: Mean P/E of broad market index
• Compare to relevant benchmarks
• Consider industry characteristics
• Relative P/E > 1 = Premium valuation
• Use sector-specific comparisons
• Consider company lifecycle stage
• Account for growth differences
• Comparing to inappropriate benchmarks
• Not considering growth disparities
• Ignoring industry cyclicality
Which of the following is a limitation of using P/E ratios for valuation?
The answer is D) All of the above. P/E ratios have several limitations: they're undefined for companies with negative earnings (division by zero), they don't account for debt levels (unlike EV/EBITDA), and they can be manipulated by one-time accounting items. P/E should be used alongside other metrics.
Understanding P/E limitations is crucial for proper analysis. Companies with negative earnings have no meaningful P/E ratio. P/E doesn't consider capital structure, making it less suitable for comparing companies with different debt levels. It also doesn't account for growth sustainability or cash flow quality.
Limitations: Constraints of a particular metric
Capital Structure: Mix of debt and equity financing
Complementary Metrics: Other ratios used together
• Don't use P/E for unprofitable companies
• Consider debt levels separately
• Use multiple valuation metrics
• Use PEG ratio for growth companies
• Consider EV/EBITDA for debt comparison
• Combine with cash flow metrics
• Using P/E for unprofitable companies
• Relying solely on P/E ratio
• Not considering accounting manipulations
FAQ
Q: How do I calculate P/E ratio?
A: Use the formula: \( P/E = \frac{Stock\ Price}{Earnings\ Per\ Share} \)
For a stock priced at $100 with EPS of $5:
\( P/E = \frac{100}{5} = 20 \)
This means investors pay $20 for every $1 of earnings. Use trailing twelve months (TTM) or forward EPS for more accurate analysis.
Q: What's the difference between trailing and forward P/E?
A: The differences are:
- Trailing P/E: Uses actual past 12 months of earnings
- Forward P/E: Uses projected future earnings
Example: Stock at $60 with TTM EPS of $3 (Trailing P/E = 20) and expected EPS of $4 (Forward P/E = 15). Forward P/E is often more relevant as it reflects expectations.
Trailing P/E can be distorted by one-time events, while forward P/E depends on forecast accuracy.