Stock Average Down Calculator
Cost basis optimization • 2026 market strategy
Stock Average Down Formula:
Show Calculator\( \text{New Cost Basis} = \frac{\text{Total Investment}}{\text{Total Shares}} \)
Where:
- \( \text{Total Investment} = \sum(\text{Share Quantity} \times \text{Purchase Price}) \)
- \( \text{Total Shares} = \sum(\text{Share Quantity}) \)
- \( \text{Breakeven Price} = \text{New Cost Basis} \times (1 + \text{Commission Rate}) \)
This formula calculates the weighted average cost per share when averaging down on a stock position. It helps determine the breakeven point and potential profit/loss scenarios.
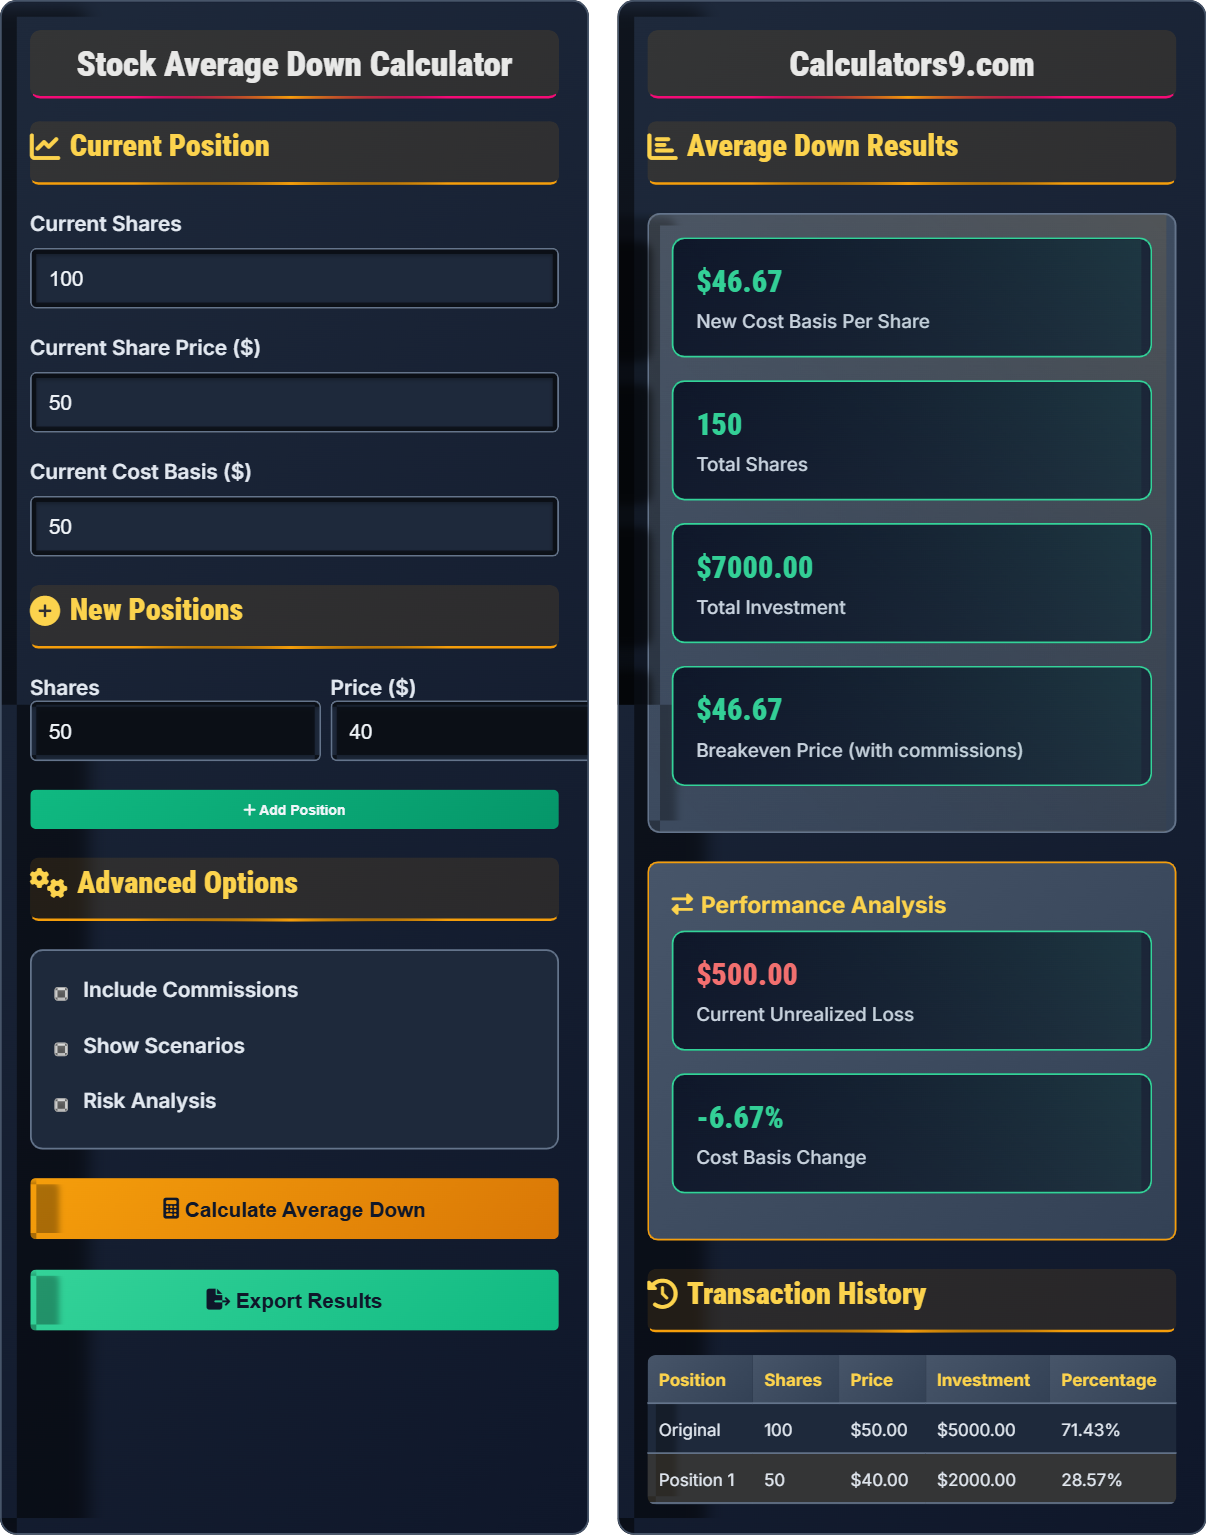
Example: Original 100 shares at $50 ($5,000) + Additional 50 shares at $40 ($2,000) = Total Investment $7,000 / 150 shares = New Cost Basis $46.67 per share.
Current Position
New Positions
Advanced Options
Average Down Results
Transaction History
| Position | Shares | Price | Investment | Percentage |
|---|
Stock Averaging Down Strategy Guide
Averaging down is an investment strategy where you purchase additional shares of a stock at a lower price than your original purchase price. This reduces your overall cost basis per share and can potentially turn a losing position into a profitable one when the stock recovers.
The formula for calculating your new cost basis when averaging down:
Where Total Investment is the sum of all purchases and Total Shares is the sum of all shares acquired.
Key risks to consider when averaging down:
- Dollar Cost Averaging Trap: Continuously buying as the stock continues to decline
- Company Fundamentals: The decline may reflect deteriorating business conditions
- Capital Allocation: Concentrating too much capital in a single position
- Emotional Investing: Averaging down due to inability to accept losses
- Set Stop-Losses: Define maximum loss thresholds before averaging down
- Size Appropriately: Don't over-commit capital to a single position
- Reassess Fundamentals: Ensure the original investment thesis still holds
- Use Technical Analysis: Look for signs of reversal before adding positions
- Consider Time: Allow sufficient time between purchases to reassess
Averaging Down Basics
Purchasing additional shares at lower prices to reduce average cost basis.
\( \text{New Cost Basis} = \frac{\text{Total Investment}}{\text{Total Shares}} \)
Calculate weighted average of all purchases.
- Only average down on fundamentally sound stocks
- Never average down due to emotional attachment
- Set predetermined stop-loss levels
- Size positions appropriately
Strategy Considerations
Wait for clear technical or fundamental signals before adding positions.
- Limit total position to 5-10% of portfolio
- Reduce position size with each addition
- Never exceed 15% allocation
- Consider sector concentration
- Set maximum drawdown limits
- Monitor correlation with portfolio
- Have exit strategy before entry
- Regular fundamental review
Stock Averaging Down Learning Quiz
You originally bought 100 shares of a stock at $50 per share. Later, you purchased 50 additional shares at $40 per share. What is your new cost basis per share?
The answer is B) $46.67. To calculate the new cost basis: Original investment = 100 shares × $50 = $5,000. Additional investment = 50 shares × $40 = $2,000. Total investment = $5,000 + $2,000 = $7,000. Total shares = 100 + 50 = 150 shares. New cost basis = $7,000 ÷ 150 shares = $46.67 per share.
This calculation demonstrates the concept of weighted average cost basis. The formula takes into account both the quantity of shares and their purchase prices. More expensive shares have a greater impact on the average than cheaper ones. This is crucial for understanding your breakeven point and potential profits/losses.
Cost Basis: The average price per share of all purchases of a security
Weighted Average: An average where some values contribute more than others based on quantity
Break-even Price: The price at which you recover your total investment
• Cost basis = Total investment ÷ Total shares
• Each additional purchase affects the weighted average
• Higher-cost shares have more influence on the average
• Remember: (Total $ Invested) ÷ (Total Shares) = Cost Basis
• Keep track of all transactions for accurate calculations
• Use spreadsheets for complex multiple purchase scenarios
• Simply averaging the purchase prices instead of using weighted average
• Forgetting to include commission fees in the calculation
• Not accounting for all previous purchases in the calculation
If you have 200 shares with a cost basis of $35 per share and you sell at $40 per share, what is your profit? Include the effect of a 1% commission fee on the sale. Show your work.
Step 1: Calculate total cost basis = 200 shares × $35 = $7,000
Step 2: Calculate gross sale proceeds = 200 shares × $40 = $8,000
Step 3: Calculate commission fee = $8,000 × 1% = $80
Step 4: Calculate net proceeds = $8,000 - $80 = $7,920
Step 5: Calculate profit = Net proceeds - Cost basis = $7,920 - $7,000 = $920
Step 6: Calculate ROI = ($920 ÷ $7,000) × 100 = 13.14%
Therefore, your profit is $920 with a return of 13.14%.
This problem demonstrates the importance of considering transaction costs in investment calculations. Commission fees reduce your net profit, so they must be accounted for in your breakeven and profit calculations. The example shows how even small percentage fees can impact your overall returns.
Gross Proceeds: Total amount received from selling securities before fees
Net Proceeds: Gross proceeds minus all transaction fees
Return on Investment (ROI): Profit expressed as a percentage of the original investment
• Always subtract commission fees from gross proceeds
• ROI = (Profit ÷ Cost Basis) × 100
• Transaction costs reduce net profitability
• Calculate commission fees before determining profit
• Use the formula: Net Profit = (Sale Price × Shares) × (1 - Commission%) - Cost Basis
• Track all fees to accurately measure investment performance
• Forgetting to subtract commission fees from sale proceeds
• Including commission in the cost basis instead of subtracting from proceeds
• Calculating ROI based on gross rather than net profit
Sarah originally purchased 100 shares of TechCorp at $100 per share. The stock fell to $80, and she decided to average down by purchasing 50 more shares. If the stock then recovered to $90, what would be her total return on the entire position? Assume no commission fees.
Step 1: Calculate original investment = 100 shares × $100 = $10,000
Step 2: Calculate additional investment = 50 shares × $80 = $4,000
Step 3: Calculate total investment = $10,000 + $4,000 = $14,000
Step 4: Calculate total shares = 100 + 50 = 150 shares
Step 5: Calculate new cost basis = $14,000 ÷ 150 = $93.33 per share
Step 6: Calculate current value = 150 shares × $90 = $13,500
Step 7: Calculate profit/loss = $13,500 - $14,000 = -$500 (loss)
Step 8: Calculate ROI = (-$500 ÷ $14,000) × 100 = -3.57%
Therefore, Sarah would have a $500 loss with a return of -3.57% on her entire position.
This example shows that averaging down doesn't guarantee profits. Even though the stock recovered significantly from the lowest point, Sarah still experienced a loss because her average cost basis was higher than the recovery price. This demonstrates the importance of timing and fundamental analysis when deciding to average down.
Averaging Down: Purchasing additional shares at a lower price to reduce average cost
Total Return: Overall gain or loss on an investment including all purchases
Recovery Point: The price needed to breakeven on the entire position
• Averaging down only helps if the stock rises above the new cost basis
• The recovery point increases with each additional purchase
• Timing and fundamental analysis are critical for success
• Calculate the new breakeven point before averaging down
• Consider the probability of reaching the breakeven price
• Evaluate whether the company's fundamentals justify additional investment
• Assuming that averaging down automatically improves the investment outcome
• Not calculating the new breakeven point after additional purchases
• Averaging down without considering underlying business fundamentals
Mike owns 200 shares of a stock at an average cost of $50 per share. The stock is currently trading at $40 per share (20% decline). He wants to average down by purchasing 100 more shares at $40. If he believes the stock will eventually recover to $55, what is his potential return? However, if the stock continues declining to $35, what would be his loss? Calculate both scenarios.
Scenario 1 - Recovery to $55:
Original investment: 200 × $50 = $10,000
Additional investment: 100 × $40 = $4,000
Total investment: $10,000 + $4,000 = $14,000
Total shares: 200 + 100 = 300 shares
New cost basis: $14,000 ÷ 300 = $46.67 per share
Value at $55: 300 × $55 = $16,500
Profit: $16,500 - $14,000 = $2,500
ROI: ($2,500 ÷ $14,000) × 100 = 17.86%
Scenario 2 - Decline to $35:
Value at $35: 300 × $35 = $10,500
Loss: $10,500 - $14,000 = -$3,500
ROI: (-$3,500 ÷ $14,000) × 100 = -25.00%
Therefore, Mike could gain 17.86% if the stock recovers to $55, but lose 25.00% if it falls to $35.
This demonstrates the asymmetric risk-reward profile of averaging down. While averaging down can enhance gains when the stock recovers, it also amplifies losses if the stock continues declining. The key insight is that averaging down increases your exposure to the stock, making your outcomes more sensitive to price movements. This highlights the importance of thorough risk assessment before averaging down.
Asymmetric Risk: When potential losses and gains are not equal in magnitude
Exposure: The amount of capital invested in a particular security
Risk-Reward Ratio: The relationship between potential loss and potential gain
• Averaging down increases your position size and risk exposure
• Potential losses increase proportionally with additional investments
• Always assess risk-reward ratio before averaging down
• Model multiple price scenarios before averaging down
• Set clear stop-loss levels to limit downside risk
• Consider the probability of each scenario occurring
• Only modeling positive scenarios when averaging down
• Underestimating the increased risk from larger position size
• Not having a plan for continued decline after averaging down
Which of the following is the MOST important factor to consider before averaging down on a stock?
The answer is B) The company's fundamental business health. Before averaging down, it's crucial to determine whether the stock's decline is due to temporary market conditions or fundamental business deterioration. Averaging down on a fundamentally sound company that's temporarily undervalued makes sense, but doing so on a company with deteriorating fundamentals could lead to permanent capital loss. The other factors, while potentially relevant, are secondary to the core business health.
This question emphasizes the importance of fundamental analysis in investment decisions. Averaging down should never be driven by emotional factors or technical indicators alone. The decision should be based on whether the underlying business is still healthy and likely to recover. This approach helps distinguish between temporary price weakness and permanent business impairment.
Fundamental Analysis: Evaluating a company's business health, financials, and prospects
Technical Analysis: Studying price patterns and trading activity
Emotional Investing: Making investment decisions based on feelings rather than analysis
• Always reassess business fundamentals before averaging down
• Never average down based solely on price decline
• Distinguish between temporary weakness and permanent impairment
• Review quarterly earnings and business metrics before averaging down
• Assess industry trends and competitive position
• Consider management quality and strategic direction
• Averaging down simply because the price is lower (buying the dip mentality)
• Letting emotional attachment drive investment decisions
• Not updating the investment thesis after negative developments
FAQ
Q: When is the best time to average down on a stock position?
A: The best time to average down is when:
- Fundamentals remain intact: The company's business model, financials, and competitive position haven't deteriorated
- Technical support exists: The stock is near key support levels, moving averages, or oversold conditions
- Market conditions: The decline is due to broad market weakness, not company-specific issues
- Valuation appears attractive: The stock is trading below intrinsic value based on fundamental analysis
Mathematically, if your original cost basis is \( CB_1 \) and you're considering adding shares at price \( P_2 \), averaging down is beneficial if you believe the stock will recover to a price above your new weighted average cost basis: \( CB_{new} = \frac{(S_1 \times CB_1) + (S_2 \times P_2)}{S_1 + S_2} \)
Q: What are the risks of averaging down compared to dollar-cost averaging?
A: The key differences in risk between averaging down and dollar-cost averaging (DCA) are:
- Concentration Risk: Averaging down increases position size in a single stock, while DCA spreads across multiple investments
- Timing Risk: Averaging down requires correct timing of the bottom, whereas DCA removes timing pressure
- Fundamental Risk: Averaging down assumes the original investment thesis is still valid, while DCA doesn't require such assumptions
- Psychological Risk: Averaging down can become a "hope trap" where investors continue buying as prices fall
Mathematically, the expected value of averaging down depends on the probability of recovery: \( EV = P(recovery) \times Profit_{recovery} + P(further\_decline) \times Loss_{decline} \)
For DCA, the risk is more evenly distributed across time periods regardless of price movements.