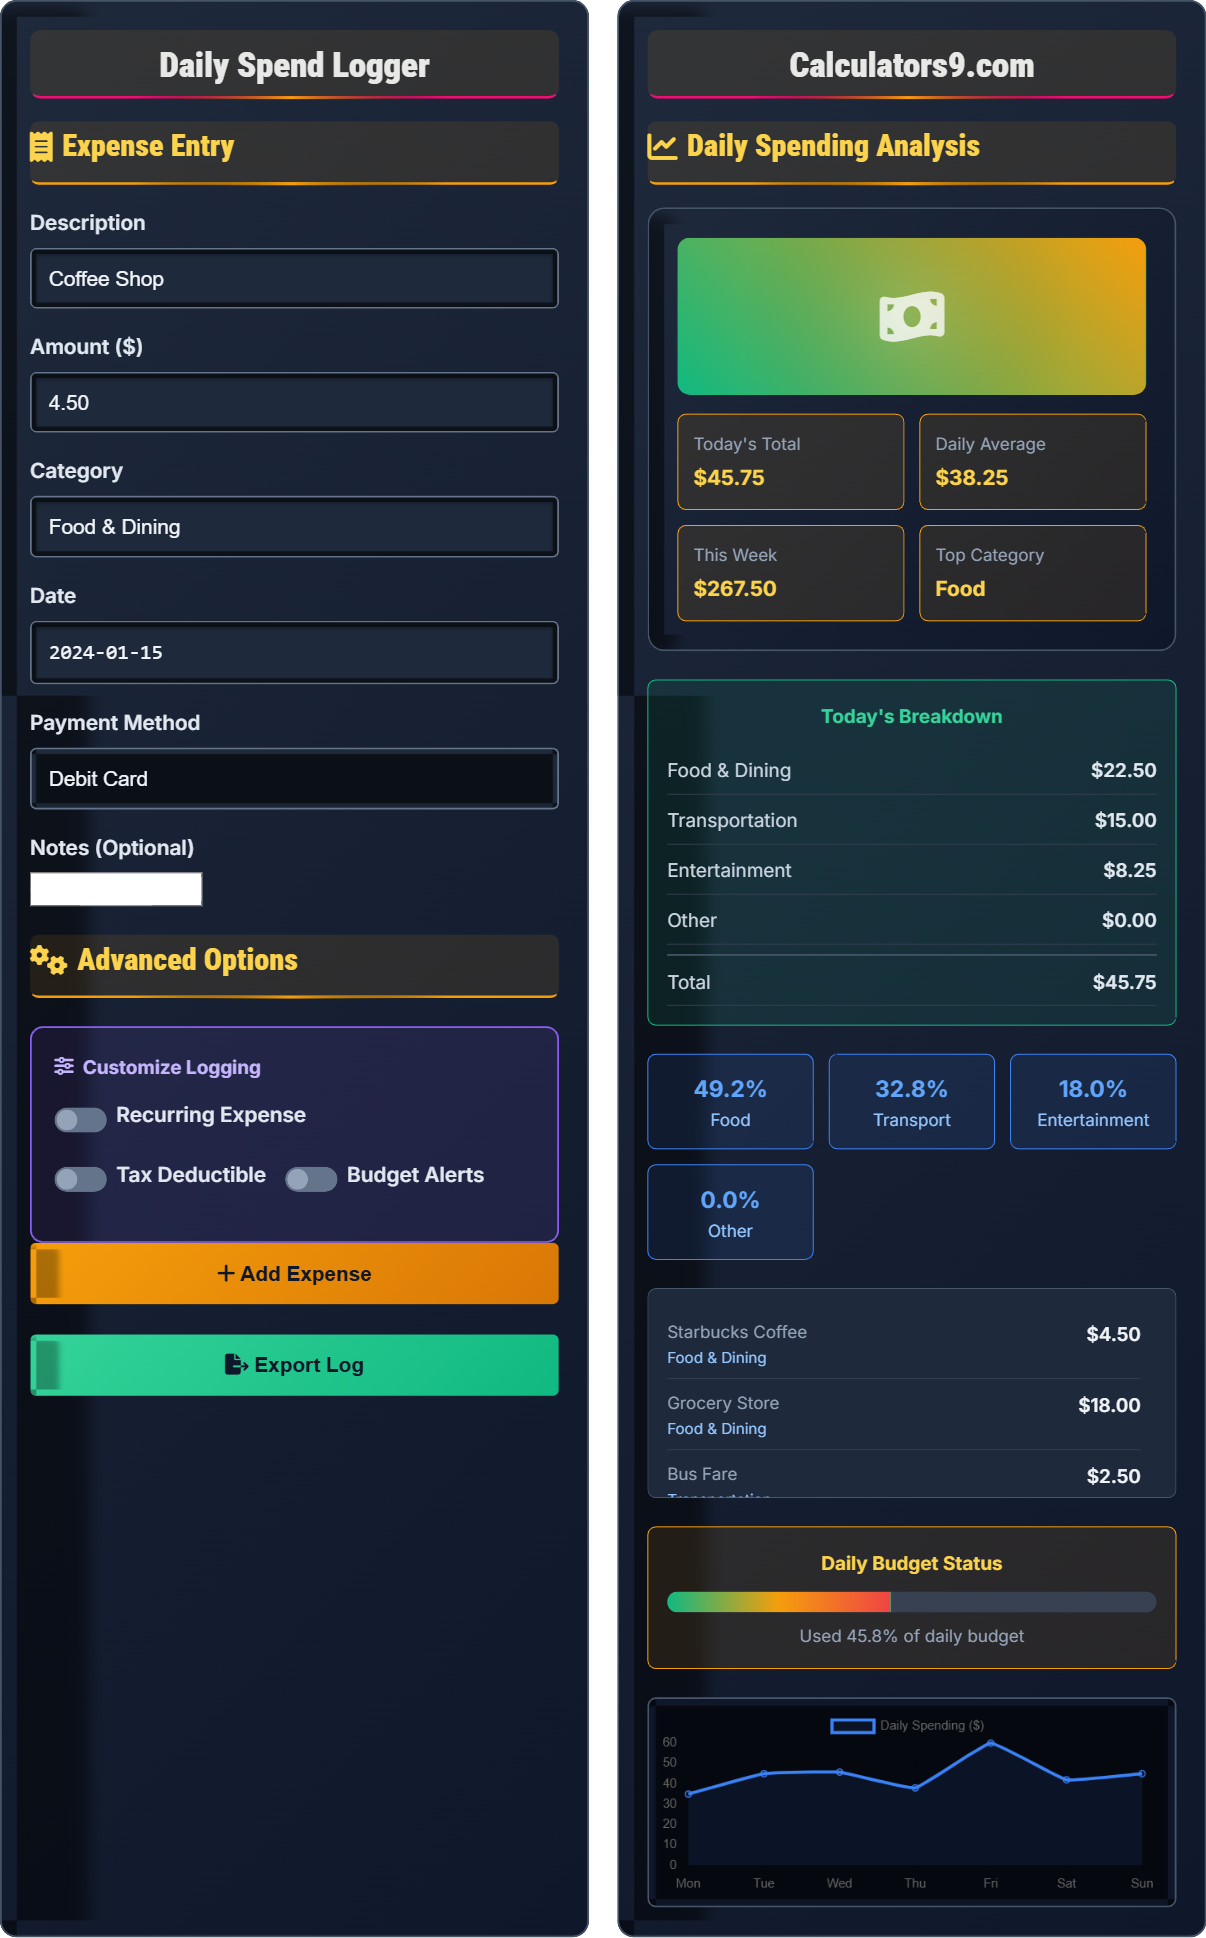
Daily Spend Logger
Track spending • Analyze habits
Daily Spending Formula:
Show Calculator\( DS = \sum_{i=1}^{n} E_i \)
\( DA = \frac{\sum_{j=1}^{m} DS_j}{m} \)
\( DP = \frac{DS}{TB} \times 100 \)
Where:
- \( DS \) = Daily spending total
- \( E_i \) = Individual expense i
- \( DA \) = Daily average spending
- \( DS_j \) = Daily spending on day j
- \( m \) = Number of days
- \( DP \) = Daily spending percentage of budget
- \( TB \) = Total daily budget
- \( n \) = Number of expenses in a day
Weekly Spending: \( WS = \sum_{k=1}^{7} DS_k \)
Monthly Spending: \( MS = \sum_{l=1}^{30} DS_l \)
Example: 5 expenses of $10, $15, $8, $25, $12:
\( DS = 10 + 15 + 8 + 25 + 12 = \$70 \)
If daily budget is $100: \( DP = \frac{70}{100} \times 100 = 70\% \)
Expense Entry
Advanced Options
Daily Spending Analysis
Daily Spending Tracking Basics
Daily spending tracking is the practice of recording and analyzing daily expenses to understand spending patterns and manage budgets effectively.
\(DS = \sum_{i=1}^{n} E_i\)
Where DS=daily spending, Ei=expense i, n=number of expenses.
- Record expenses immediately
- Track all spending amounts
- Categorize expenses consistently
- Review spending regularly
Spending Analysis
Regular analysis of spending patterns helps identify areas for improvement and budget optimization.
- Track spending by category
- Calculate daily averages
- Identify spending patterns
- Set spending limits
- Monitor budget adherence
- Adjust spending habits
- Review spending weekly
- Compare to budget goals
- Look for unnecessary expenses
- Track payment methods
Daily Spending Tracking Learning Quiz
Why is it important to track daily expenses immediately after purchase?
The answer is B) To avoid forgetting small purchases. Immediate tracking prevents losing receipts or forgetting minor expenses that can add up significantly over time.
Small daily purchases like coffee, snacks, or transportation can accumulate to substantial amounts monthly. Recording them immediately ensures accurate tracking and prevents memory gaps that lead to incomplete records.
Immediate Tracking: Recording expenses right after purchase
Memory Gaps: Forgetting to record expenses
Accumulation Effect: Small amounts adding up over time
• Record expenses immediately
• Include all amounts regardless of size
• Use consistent categories
• Use mobile apps for instant logging
• Keep receipts for verification
• Set daily logging reminders
• Forgetting to log small purchases
• Delaying expense recording
• Not tracking all payment methods
If you spent $12.50 on lunch, $3.75 on coffee, $25.00 on groceries, and $8.25 on gas today, what is your total daily spending? What percentage of a $100 daily budget have you used?
Total daily spending: $12.50 + $3.75 + $25.00 + $8.25 = $49.50
Percentage of budget: ($49.50 ÷ $100) × 100 = 49.5%
Therefore, total daily spending is $49.50, which represents 49.5% of the daily budget.
This calculation demonstrates the basic daily spending formula: \(DS = \sum_{i=1}^{n} E_i\). Converting to a percentage of budget helps visualize spending relative to financial goals. This percentage approach makes it easier to stay within budget limits.
Daily Spending: Total expenses in one day
Budget Percentage: Spending relative to budget
Expense Summation: Adding all daily expenses
• Sum all daily expenses
• Calculate percentage of budget
• Monitor spending trends
• Use: Total = Sum of all expenses
• Calculate: (Total ÷ Budget) × 100
• Track percentage to stay on budget
• Forgetting to include all expenses
• Not calculating percentage of budget
• Missing small purchases
Sarah spent $85, $45, $60, $90, $35, $55, and $70 over the past 7 days. What is her daily average spending? If her daily budget is $70, is she staying within budget?
Total weekly spending: $85 + $45 + $60 + $90 + $35 + $55 + $70 = $440
Daily average: $440 ÷ 7 = $62.86
Budget comparison: $62.86 vs $70 daily budget
Since $62.86 < $70, Sarah is staying within her daily budget on average.
This example shows how to calculate daily averages over a period: \(DA = \frac{\sum_{j=1}^{m} DS_j}{m}\). Comparing the average to the budget reveals overall budget adherence. Even though some days exceeded the budget, the average shows she's on track.
Daily Average: Mean spending per day
Budget Adherence: Staying within spending limits
Weekly Analysis: Reviewing spending over a week
• Calculate weekly averages
• Compare to daily budget
• Look for spending patterns
• Use: Average = Total ÷ Days
• Compare average to budget
• Identify high-spending days
• Not calculating daily averages
• Only looking at individual days
• Forgetting to compare to budget
John analyzed his daily spending and found he spent $150 on food, $80 on transportation, $45 on entertainment, and $25 on other expenses in a week. What percentage of his weekly spending went to food? If his weekly budget is $400, what percentage has he used? (Hint: Calculate total spending first)
Step 1: Calculate total weekly spending = $150 + $80 + $45 + $25 = $300
Step 2: Calculate food percentage = ($150 ÷ $300) × 100 = 50%
Step 3: Calculate budget usage = ($300 ÷ $400) × 100 = 75%
Therefore, 50% of spending went to food, and John used 75% of his weekly budget.
This problem demonstrates category analysis: \(\%Category = \frac{Category\ Amount}{Total\ Spending} \times 100\). Understanding spending distribution helps identify where to make adjustments. John spends half his money on food, which might indicate room for optimization.
Category Analysis: Examining spending by category
Spending Distribution: How money is allocated
Budget Usage: Percentage of budget spent
• Calculate total spending first
• Analyze category percentages
• Compare to budget limits
• Use: Category % = (Category ÷ Total) × 100
• Budget % = (Spent ÷ Budget) × 100
• Identify high-percentage categories
• Forgetting to calculate total spending
• Not analyzing by category
• Not comparing to budget
Which of the following is the BEST approach to maintain accurate daily spending records?
The answer is B) Record expenses immediately after purchase. This approach ensures accuracy and prevents forgetting small purchases that can add up significantly over time.
Immediate recording is crucial for accurate tracking. Memory fades quickly, and small purchases are often forgotten. The accumulation of small daily expenses can represent a significant portion of the budget, making immediate tracking essential for financial awareness.
Immediate Recording: Logging expenses right away
Accuracy: Precise and complete records
Financial Awareness: Knowledge of spending patterns
• Record immediately after purchase
• Include all expenses regardless of size
• Use consistent categories
• Use mobile apps for instant entry
• Keep receipts for verification
• Set up automatic categorization
• Delaying expense recording
• Forgetting small purchases
• Not tracking all payment methods
FAQ
Q: How do I calculate my daily spending average?
A: Calculate daily average spending using: \(DA = \frac{\sum_{j=1}^{m} DS_j}{m}\)
Where \(DA\) is daily average, \(DS_j\) is spending on day \(j\), and \(m\) is number of days.
Example: 7 days with spending of $50, $75, $40, $60, $80, $35, $55:
- Total: $50 + $75 + $40 + $60 + $80 + $35 + $55 = $395
- Average: $395 ÷ 7 = $56.43 per day
This average helps understand typical daily spending patterns.
Q: How can I categorize my daily expenses effectively?
A: Use consistent, meaningful categories:
- Needs: Food, transportation, utilities
- Wants: Entertainment, dining out, shopping
- Savings: Emergency fund, investments
- Debt: Credit card payments, loans
Calculate category percentages: \(\%Category = \frac{Category\ Amount}{Total\ Spending} \times 100\)
Regular categorization helps identify spending patterns and areas for optimization.