Vacancy Rate Calculator
Property management analysis • 2026 metrics
Vacancy Rate Formula:
Show the calculator\( \text{Vacancy Rate} = \frac{\text{Vacant Units}}{\text{Total Units}} \times 100\% \)
Where:
- Vacant Units = Number of unoccupied units
- Total Units = Total number of available units
Alternatively, for time-based vacancy rate:
\( \text{Vacancy Rate} = \frac{\text{Vacant Unit-Days}}{\text{Total Unit-Days}} \times 100\% \)
Vacancy rate is a critical metric for property managers and real estate investors, indicating the percentage of units that are unoccupied and generating no rental income. A lower vacancy rate indicates better property performance.
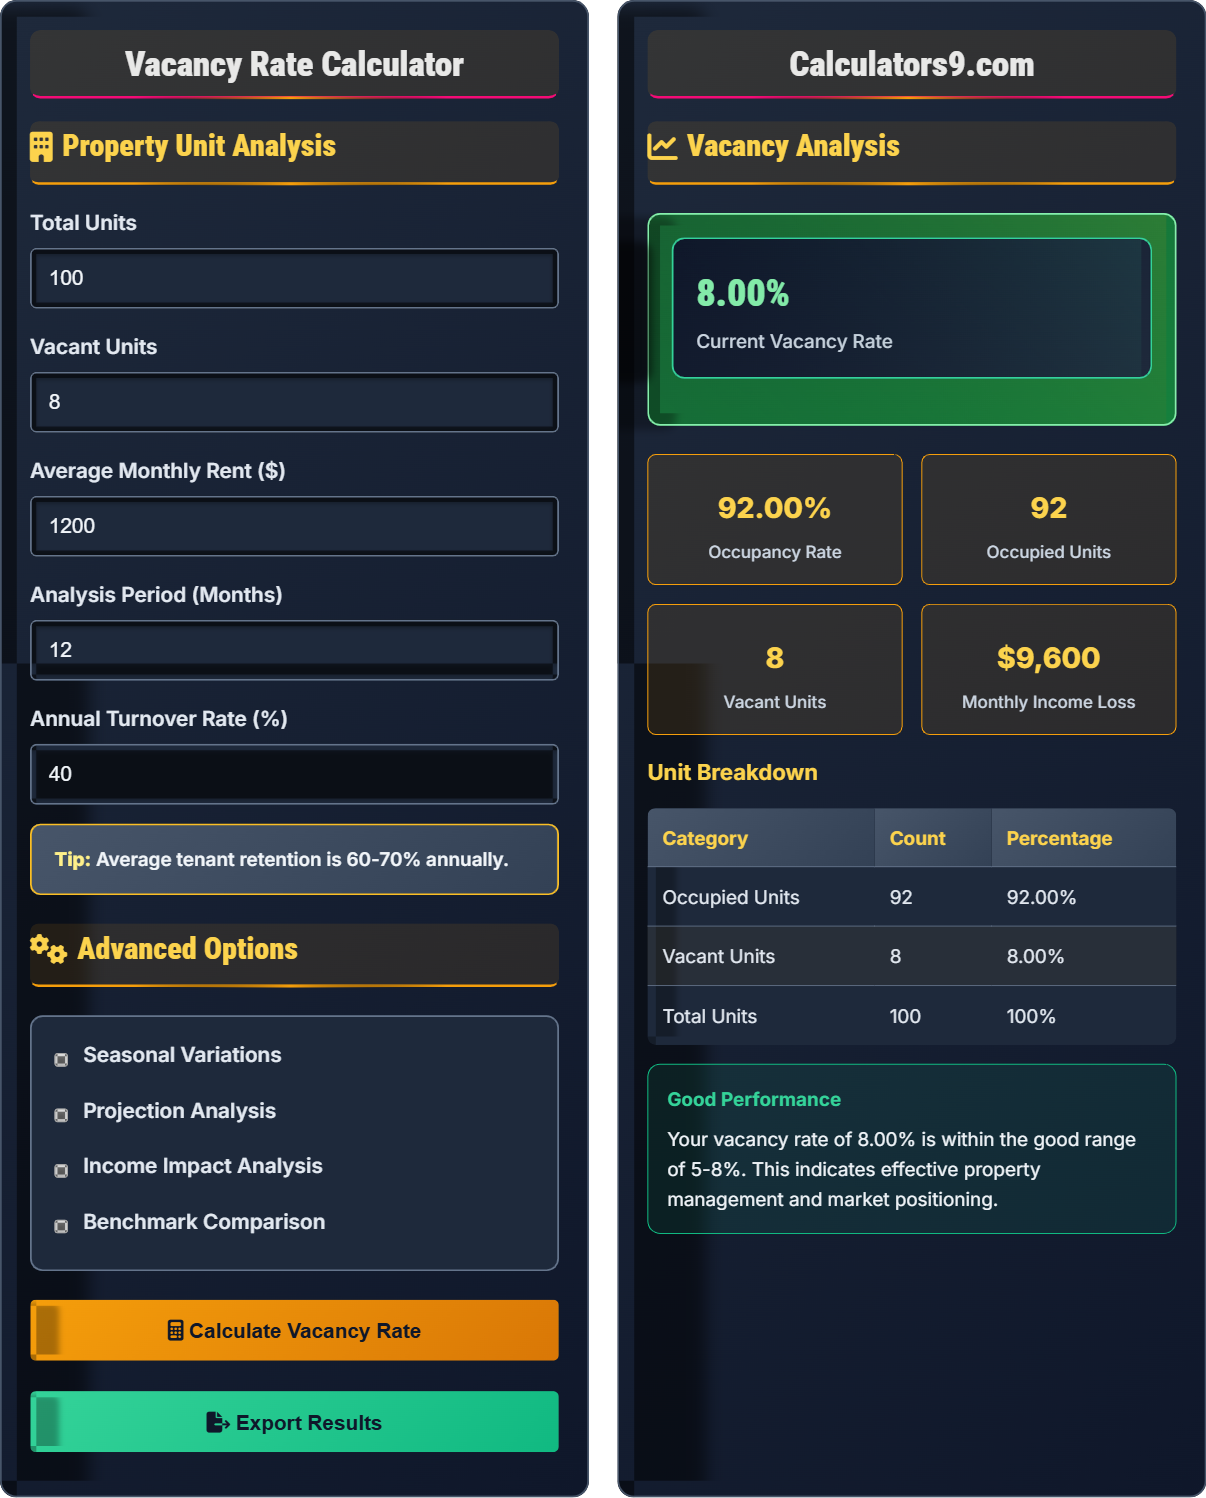
Example: If a property has 100 units and 8 are vacant, the vacancy rate would be: (8 ÷ 100) × 100% = 8%.
Industry benchmarks typically range from 5-10% for well-managed properties in stable markets.
Property Unit Analysis
Advanced Options
Vacancy Analysis
Unit Breakdown
| Category | Count | Percentage |
|---|---|---|
| Occupied Units | 92 | 92.00% |
| Vacant Units | 8 | 8.00% |
| Total Units | 100 | 100% |
Vacancy Rate Visualization
Vacancy Rate Management Guide
Vacancy rate is a critical metric in property management that measures the percentage of unoccupied units in a rental property. It directly impacts the property's revenue and profitability. The rate is calculated by dividing the number of vacant units by the total number of units and multiplying by 100.
Vacancy rates fluctuate based on market conditions, property location, rental rates, tenant screening effectiveness, and seasonal factors. Understanding and managing vacancy rates is essential for property owners and managers to optimize revenue.
The standard vacancy rate calculation uses the following formula:
Alternative time-based calculation:
Where:
- Vacant Units = Number of unoccupied units
- Total Units = Total number of available units
- Vacant Unit-Days = Sum of days each unit was vacant during the period
- Total Unit-Days = Total possible rental days (units × days in period)
Industry benchmarks for vacancy rates:
- Excellent: 0-5% vacancy rate
- Good: 5-8% vacancy rate
- Average: 8-12% vacancy rate
- Concerning: 12-15% vacancy rate
- Poor: 15%+ vacancy rate
Factors affecting optimal vacancy rates include location, property type, market conditions, and competition. A zero vacancy rate is rarely sustainable as it doesn't account for turnovers and maintenance periods.
- Competitive pricing: Set rents appropriately based on market rates
- Property maintenance: Keep units in excellent condition
- Marketing efforts: Use effective advertising and online presence
- Responsive management: Address tenant concerns promptly
- Retention programs: Encourage tenant renewals with incentives
Vacancy Rate vs Occupancy Rate
Vacancy rate and occupancy rate are complementary metrics.
\( \text{Occupancy Rate} = 100\% - \text{Vacancy Rate} \)
\( \text{Vacancy Rate} = 100\% - \text{Occupancy Rate} \)
- Vacancy Rate + Occupancy Rate = 100%
- Higher vacancy = Lower occupancy
- Lower vacancy = Higher occupancy
- Both measure unit utilization
Vacancy Rate Learning Quiz
If a property has 50 units and 5 are vacant, what is the vacancy rate?
The answer is B) 10%. Using the vacancy rate formula: Vacancy Rate = (Vacant Units ÷ Total Units) × 100%. Vacancy Rate = (5 ÷ 50) × 100% = 0.1 × 100% = 10%. Therefore, the vacancy rate is 10%.
The vacancy rate calculation is straightforward: divide the number of vacant units by the total number of units and multiply by 100 to get a percentage. This metric is essential for property managers to understand their property's performance. A 10% vacancy rate means 10% of the units are not generating rental income.
Vacancy Rate: Percentage of unoccupied units
Occupancy Rate: Percentage of occupied units
Unit Utilization: How effectively units are rented
• Vacancy Rate = (Vacant Units ÷ Total Units) × 100%
• Always express as percentage
• Compare to industry benchmarks
• Remember: Higher rate = more empty units
• Industry average is typically 5-10%
• Track trends over time
• Forgetting to multiply by 100 to get percentage
• Using occupied units instead of vacant units
• Not comparing to industry benchmarks
If a property has a vacancy rate of 12%, what is its occupancy rate?
The occupancy rate is 88%. The relationship between vacancy rate and occupancy rate is: Occupancy Rate = 100% - Vacancy Rate. Occupancy Rate = 100% - 12% = 88%. Therefore, if the vacancy rate is 12%, the occupancy rate is 88%.
Vacancy rate and occupancy rate are complementary metrics that always add up to 100%. If you know one, you can easily calculate the other. This relationship is fundamental to property management analysis. Occupancy rate represents the percentage of units that are rented and generating income, while vacancy rate represents the percentage that are not.
Complementary Metrics: Metrics that sum to 100%
Revenue Generation: Occupied units produce income
Utilization Rate: How effectively assets are used
• Vacancy Rate + Occupancy Rate = 100%
• Occupancy Rate = 100% - Vacancy Rate
• Both measure unit utilization
• Remember they sum to 100%
• Focus on improving occupancy
• Monitor both metrics together
• Confusing the two metrics
• Not understanding the relationship
• Focusing only on one metric
A property manager has 200 units with an average rent of $1,500/month. If the vacancy rate is 10%, what is the monthly income loss due to vacant units?
Step 1: Calculate the number of vacant units
Vacant Units = Total Units × Vacancy Rate
Vacant Units = 200 × 10% = 200 × 0.10 = 20 units
Step 2: Calculate monthly income loss
Monthly Income Loss = Vacant Units × Average Rent
Monthly Income Loss = 20 × $1,500 = $30,000
Therefore, the property manager loses $30,000 in monthly rental income due to vacant units.
This calculation demonstrates the financial impact of vacancy rates. Each vacant unit represents lost revenue equal to the monthly rent. For a property with 200 units and a 10% vacancy rate, 20 units are not generating income, resulting in a $30,000 monthly loss. This highlights the importance of maintaining low vacancy rates for property profitability.
Revenue Impact: Financial effect of vacant units
Income Loss: Revenue not collected due to vacancies
Opportunity Cost: Lost revenue from unused capacity
• Calculate vacant units first
• Multiply by average rent
• Consider this in financial planning
• Calculate potential vs actual income
• Track income loss over time
• Factor into property valuations
• Forgetting to calculate number of vacant units
• Using total units instead of vacant units
• Not considering the financial impact
A property currently has a 15% vacancy rate. The owner wants to achieve the industry benchmark of 8%. If the property has 100 units at $1,200/month rent, how much additional monthly income would be generated by reaching the target vacancy rate?
Current situation:
Current Vacant Units = 100 × 15% = 15 units
Current Occupied Units = 100 - 15 = 85 units
Current Monthly Income = 85 × $1,200 = $102,000
Target situation:
Target Vacant Units = 100 × 8% = 8 units
Target Occupied Units = 100 - 8 = 92 units
Target Monthly Income = 92 × $1,200 = $110,400
Additional Monthly Income = $110,400 - $102,000 = $8,400
By reducing the vacancy rate from 15% to 8%, the property would generate an additional $8,400 in monthly rental income.
This example shows the significant financial impact of improving vacancy rates. Reducing the rate from 15% to 8% (a 7 percentage point improvement) increases occupied units from 85 to 92, generating $8,400 more in monthly income. This demonstrates why vacancy rate management is crucial for property profitability and provides a concrete target for improvement efforts.
Improvement Target: Desired performance level
Financial Impact: Monetary benefit of improvements
Performance Gap: Difference between current and target
• Calculate current and target states
• Find the difference in income
• Use industry benchmarks as targets
• Set realistic improvement targets
• Calculate ROI of improvement efforts
• Monitor progress toward targets
• Setting unrealistic targets
• Not quantifying financial benefits
• Failing to track progress
According to industry standards, what vacancy rate range is considered "good" performance?
The answer is B) 5-8%. In the property management industry, a vacancy rate of 5-8% is generally considered "good" performance. This range indicates effective property management while allowing for normal turnovers and maintenance periods. A rate of 0-5% is considered excellent, 8-12% is average, and anything above 12% may indicate issues with the property or market.
Industry benchmarks provide context for interpreting vacancy rates. These ranges can vary by property type, location, and market conditions, but the 5-8% range is commonly accepted as good performance. Property managers should understand these benchmarks to set appropriate targets and evaluate their performance relative to industry standards.
Industry Benchmark: Standard for comparison
Performance Range: Acceptable level of operation
Market Standard: Typical performance in the industry
• Compare rates to industry standards
• Consider local market conditions
• Adjust benchmarks by property type
• Research local market benchmarks
• Compare to similar properties
• Track industry trends
• Not comparing to industry standards
• Using inappropriate benchmarks
• Ignoring local market conditions
FAQ
Q: How do seasonal variations affect vacancy rates and how should I account for them?
A: Seasonal variations significantly impact vacancy rates, especially in markets with high transient populations:
- College towns: Vacancy rates may spike during summer breaks when students move out
- Tourist destinations: Short-term rentals may have varying occupancy based on season
- Corporate areas: Business relocations can cause temporary spikes in vacancies
To account for seasonal variations:
- Track monthly trends: Monitor vacancy rates throughout the year to identify patterns
- Adjust expectations: Set different targets for peak and off seasons
- Plan marketing: Increase marketing efforts during expected high-vacancy periods
- Offer incentives: Use seasonal promotions to maintain occupancy
For accurate analysis, consider calculating both monthly and annual average vacancy rates to understand both short-term fluctuations and long-term performance.
Q: How does vacancy rate affect property value and cash flow?
A: Vacancy rate directly impacts both cash flow and property value:
Cash Flow Impact:
- Each vacant unit represents lost rental income
- For example, if rent is $1,200/month and 10% of units are vacant in a 100-unit property: 10 vacant units × $1,200 = $12,000 monthly income loss
- Annual income loss = $12,000 × 12 = $144,000
Property Value Impact:
- Property values are often calculated using cap rates (Net Operating Income ÷ Property Value)
- Higher vacancy reduces Net Operating Income
- Lower NOI results in lower property valuation
- For instance, a 2% increase in vacancy rate could decrease property value by 10-15%
Effective vacancy rate management is crucial for maintaining both current cash flow and long-term asset value.