Accounts Receivable Aging Calculator
Credit management analysis • 2026 edition
AR Aging Formulas:
Show the calculator\( \text{AR Aging Percentage} = \frac{\text{Amount in Age Bracket}}{\text{Total AR}} \times 100 \)
\( \text{Collection Effectiveness} = \frac{\text{Collected Amount}}{\text{Amount Due}} \times 100 \)
\( \text{Days Sales Outstanding} = \frac{\text{AR Balance}}{\text{Average Daily Sales}} \)
\( \text{Bad Debt Percentage} = \frac{\text{Write-offs}}{\text{Total AR}} \times 100 \)
Where:
- AR Aging Brackets: Current, 1-30, 31-60, 61-90, 90+ days
- Collection Effectiveness: Measure of collection performance
- DSO: Average number of days to collect receivables
- Bad Debt: Uncollectible amounts written off
These formulas help analyze receivables health and collection efficiency.
Example: For a company with $100,000 total AR, $20,000 aged 31-60 days:
AR Aging % (31-60 days) = $20,000 ÷ $100,000 × 100 = 20%
This indicates 20% of receivables are in the 31-60 day bracket, requiring attention.
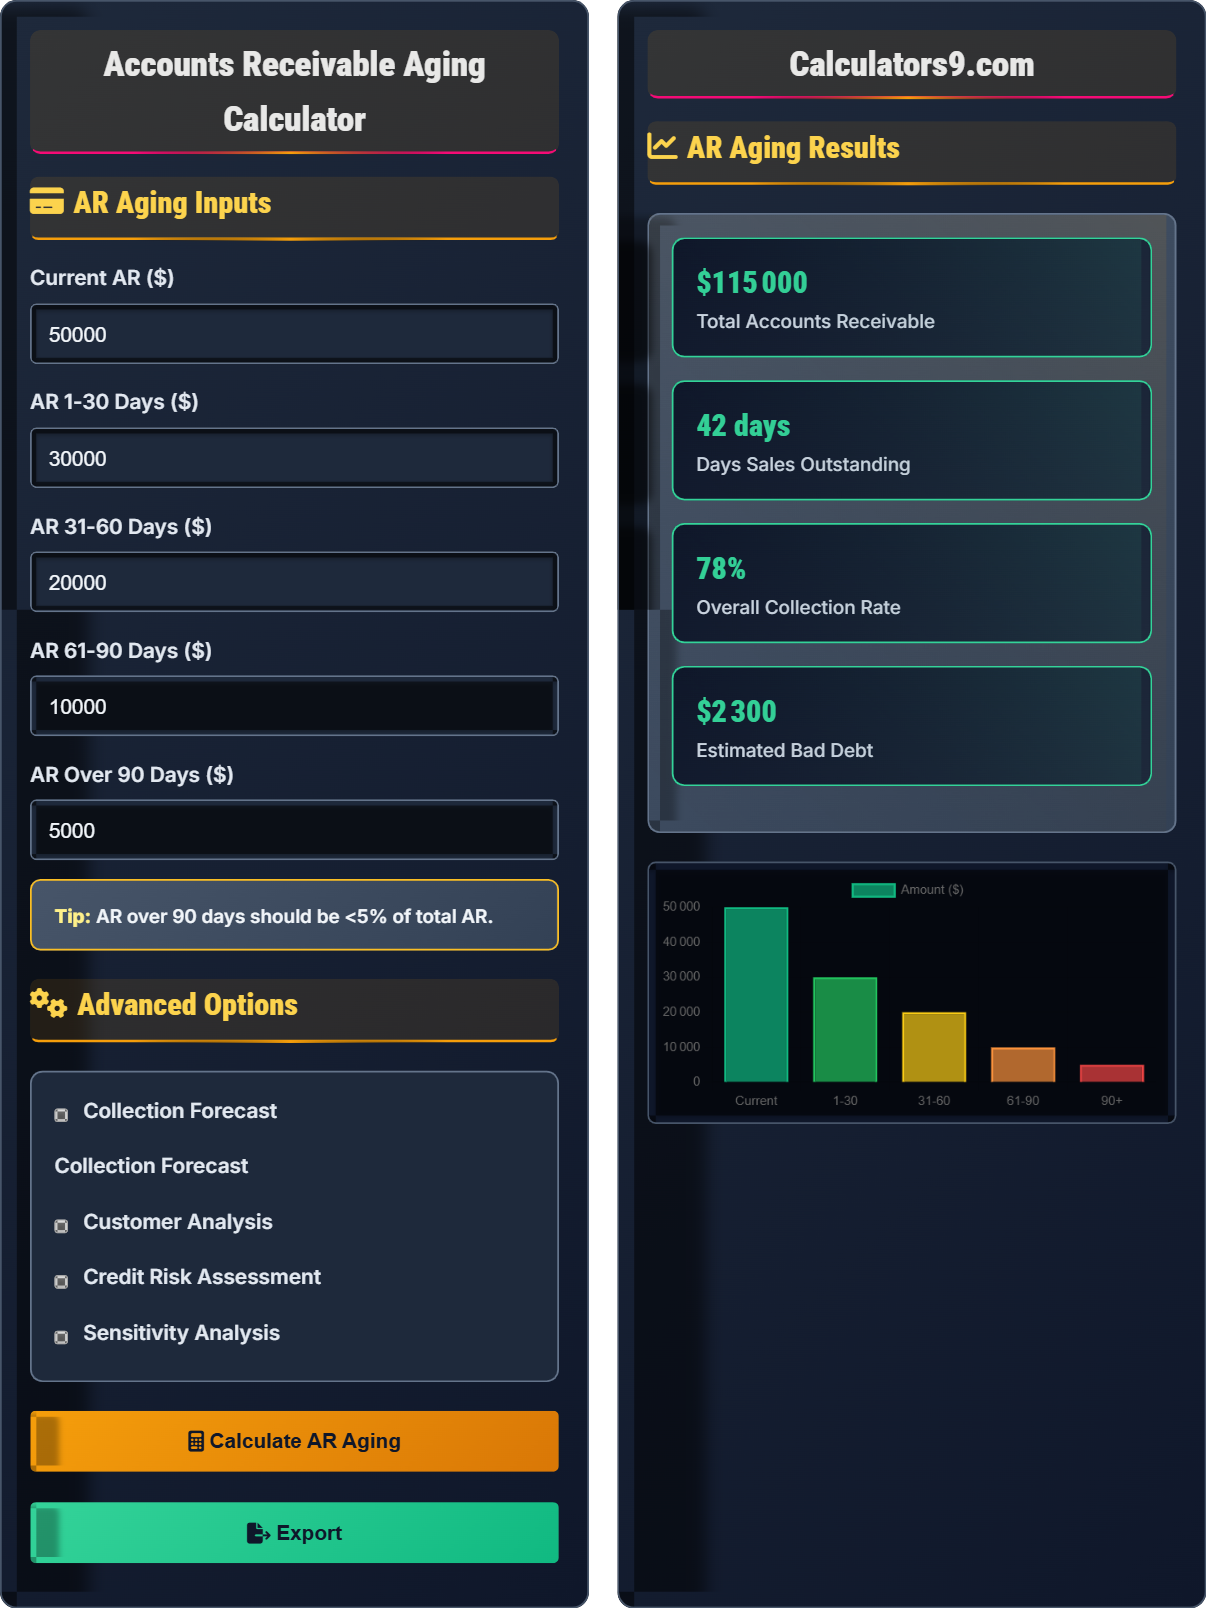
AR Aging Inputs
Advanced Options
AR Aging Results
| Age Bracket | Amount ($) | Percentage | Collection Priority | Action Required |
|---|
| Month | Expected Collections | Actual Collections | Collection Rate | Outstanding |
|---|
Comprehensive AR Aging Guide
Accounts Receivable Aging is a report that categorizes outstanding customer invoices by age, typically in brackets like 0-30, 31-60, 61-90, and 90+ days. This analysis helps businesses identify overdue payments, assess collection risks, and manage cash flow effectively. It's a critical tool for credit management and financial planning.
Key formulas for AR aging analysis:
Where:
- AR Aging % = Percentage of total receivables in each age bracket
- Collection Effectiveness = Efficiency of collection efforts
- DSO = Days Sales Outstanding (average collection period)
Effective collection approaches for different aging periods:
- 0-30 days: Gentle reminders, email notifications
- 31-60 days: Phone calls, formal letters
- 61-90 days: Escalated contact, payment plans
- 90+ days: Legal consultation, collection agencies
- Set Clear Terms: Define payment terms and communicate expectations
- Automate Processes: Use software for aging reports and collections
- Monitor Trends: Track aging patterns and collection metrics
- Segment Customers: Tailor collection approach by customer risk
- Review Credit Limits: Adjust based on payment history and risk
AR Aging Fundamentals
Categorizing receivables by how long they've been outstanding.
\( \text{AR Aging \%} = \frac{\text{Bracket Amount}}{\text{Total AR}} \times 100 \)
\( \text{DSO} = \frac{\text{AR Balance}}{\text{Daily Sales}} \)
- AR over 90 days should be <5% of total AR
- DSO should align with payment terms
- Monitor aging trends monthly
Strategies
Focus on managing aging receivables effectively.
- Implement automated reminders
- Offer early payment discounts
- Use multiple collection channels
- Monitor aging trends closely
- Customer relationships matter in collections
- Legal compliance in collection practices
- Cost-benefit analysis for collection efforts
- Documentation of all collection activities
AR Aging Learning Quiz
According to standard AR aging practices, which age bracket represents the highest collection risk?
The answer is D) 90+ days. As receivables age, the likelihood of collection decreases significantly. The 90+ days category represents the highest collection risk because these invoices have been outstanding for an extended period, suggesting potential financial difficulties with the customer or serious collection challenges.
Think of AR aging as a "risk timeline." The longer an invoice remains unpaid, the greater the probability it will become uncollectible. This follows the principle that collection success rates decline exponentially with age. Typically, the collection success rate might be 90% for 0-30 days, 70% for 31-60 days, 40% for 61-90 days, and only 10-20% for 90+ days. This is why businesses prioritize collecting the oldest receivables first.
AR Aging: Categorizing receivables by how long they've been outstanding
Collection Risk: Probability that an invoice will remain uncollected
Days Sales Outstanding (DSO): Average number of days to collect receivables
• Collection success rates decline with age
• Focus collection efforts on oldest receivables first • Monitor aging trends monthly• Implement early intervention strategies
• Set up automated aging reports • Establish clear escalation procedures• Ignoring aging trends until problems arise
• Not prioritizing collection efforts by age
• Failing to adjust credit limits based on payment history
A company has the following AR aging breakdown: $40,000 current (0-30 days), $25,000 aged 31-60 days, $15,000 aged 61-90 days, and $10,000 aged 90+ days. Calculate the total AR, the percentage of each age bracket, and determine if the aging profile is healthy based on industry standards. Also calculate the Days Sales Outstanding if the company's annual sales are $1,000,000.
Step 1: Calculate total accounts receivable
Total AR = Current + 31-60 days + 61-90 days + 90+ days
Total AR = $40,000 + $25,000 + $15,000 + $10,000 = $90,000
Step 2: Calculate percentage for each age bracket
Current (0-30 days): ($40,000 ÷ $90,000) × 100 = 44.44%
31-60 days: ($25,000 ÷ $90,000) × 100 = 27.78%
61-90 days: ($15,000 ÷ $90,000) × 100 = 16.67%
90+ days: ($10,000 ÷ $90,000) × 100 = 11.11%
Step 3: Assess aging profile health
Industry standards suggest: 90+ days should be <5% of total AR
Current: 44.44% (good - most receivables are current)
31-60 days: 27.78% (requires monitoring)
61-90 days: 16.67% (concerning - needs attention)
90+ days: 11.11% (unhealthy - exceeds 5% threshold)
Step 4: Calculate Days Sales Outstanding
Average Daily Sales = Annual Sales ÷ 365
Average Daily Sales = $1,000,000 ÷ 365 = $2,739.73
DSO = Total AR ÷ Average Daily Sales
DSO = $90,000 ÷ $2,739.73 = 32.85 days ≈ 33 days
Conclusion: The aging profile shows some concerns with 11.11% in the 90+ days bracket (exceeding the 5% threshold) and 16.67% in the 61-90 days bracket. The DSO of 33 days is reasonable if payment terms are 30 days.
This calculation demonstrates how to analyze AR aging data to assess collection health. The 11.11% in the 90+ days bracket is concerning because it exceeds the industry standard of 5%, indicating potential collection problems. The DSO of 33 days suggests the company collects receivables slightly slower than the standard 30-day payment terms, which may indicate collection inefficiencies or lenient credit policies.
DSO: Days Sales Outstanding - average collection period
Aging Analysis: Categorizing receivables by age brackets
Collection Profile: Distribution of receivables across age categories
• 90+ days AR should be <5% of total AR
• DSO should align with payment terms
• Monitor aging trends monthly
• Focus collection efforts on 61-90 days first
• Set up alerts for aging thresholds • Review credit policies regularly• Not calculating percentages for each age bracket
• Ignoring the 90+ days threshold
• Not comparing DSO to payment terms
FAQ
Q: How do I calculate the allowance for doubtful accounts based on AR aging?
A: The aging method applies different bad debt percentages to each age bracket based on historical collection experience:
- Current (0-30 days): 0.5-2% estimated loss rate
- 31-60 days: 3-5% estimated loss rate
- 61-90 days: 10-20% estimated loss rate
- 90+ days: 25-50% estimated loss rate
Formula: \( \text{Allowance} = \sum(\text{Bracket Amount} \times \text{Historical Loss Rate}) \)
For example, with $40,000 current (1% rate), $25,000 aged 31-60 (4% rate), $15,000 aged 61-90 (15% rate), and $10,000 aged 90+ (35% rate):
Allowance = ($40,000 × 0.01) + ($25,000 × 0.04) + ($15,000 × 0.15) + ($10,000 × 0.35) = $400 + $1,000 + $2,250 + $3,500 = $7,150
Q: What's the difference between AR aging and DSO, and how do they work together?
A: AR aging provides a detailed view of receivables by age brackets, while DSO gives a single average figure:
AR Aging: \( \text{Bracket \%} = \frac{\text{Amount in Bracket}}{\text{Total AR}} \times 100 \)
DSO: \( \text{DSO} = \frac{\text{AR Balance}}{\text{Average Daily Sales}} \)
They complement each other because:
- AR aging identifies specific problem areas by age
- DSO measures overall collection efficiency
- High DSO often correlates with high aging percentages
- AR aging explains why DSO is high or low