Cash Burn Rate Calculator
Business cash flow management • 2026 rates
Cash Burn Rate Formula:
Show the calculatorCash Burn Rate = (Starting Cash - Ending Cash) ÷ Time Period
Cash burn rate measures how quickly a company uses up its cash reserves. It's critical for startups and businesses with negative cash flow to understand their burn rate and runway. The formula calculates the average monthly or weekly cash consumption.
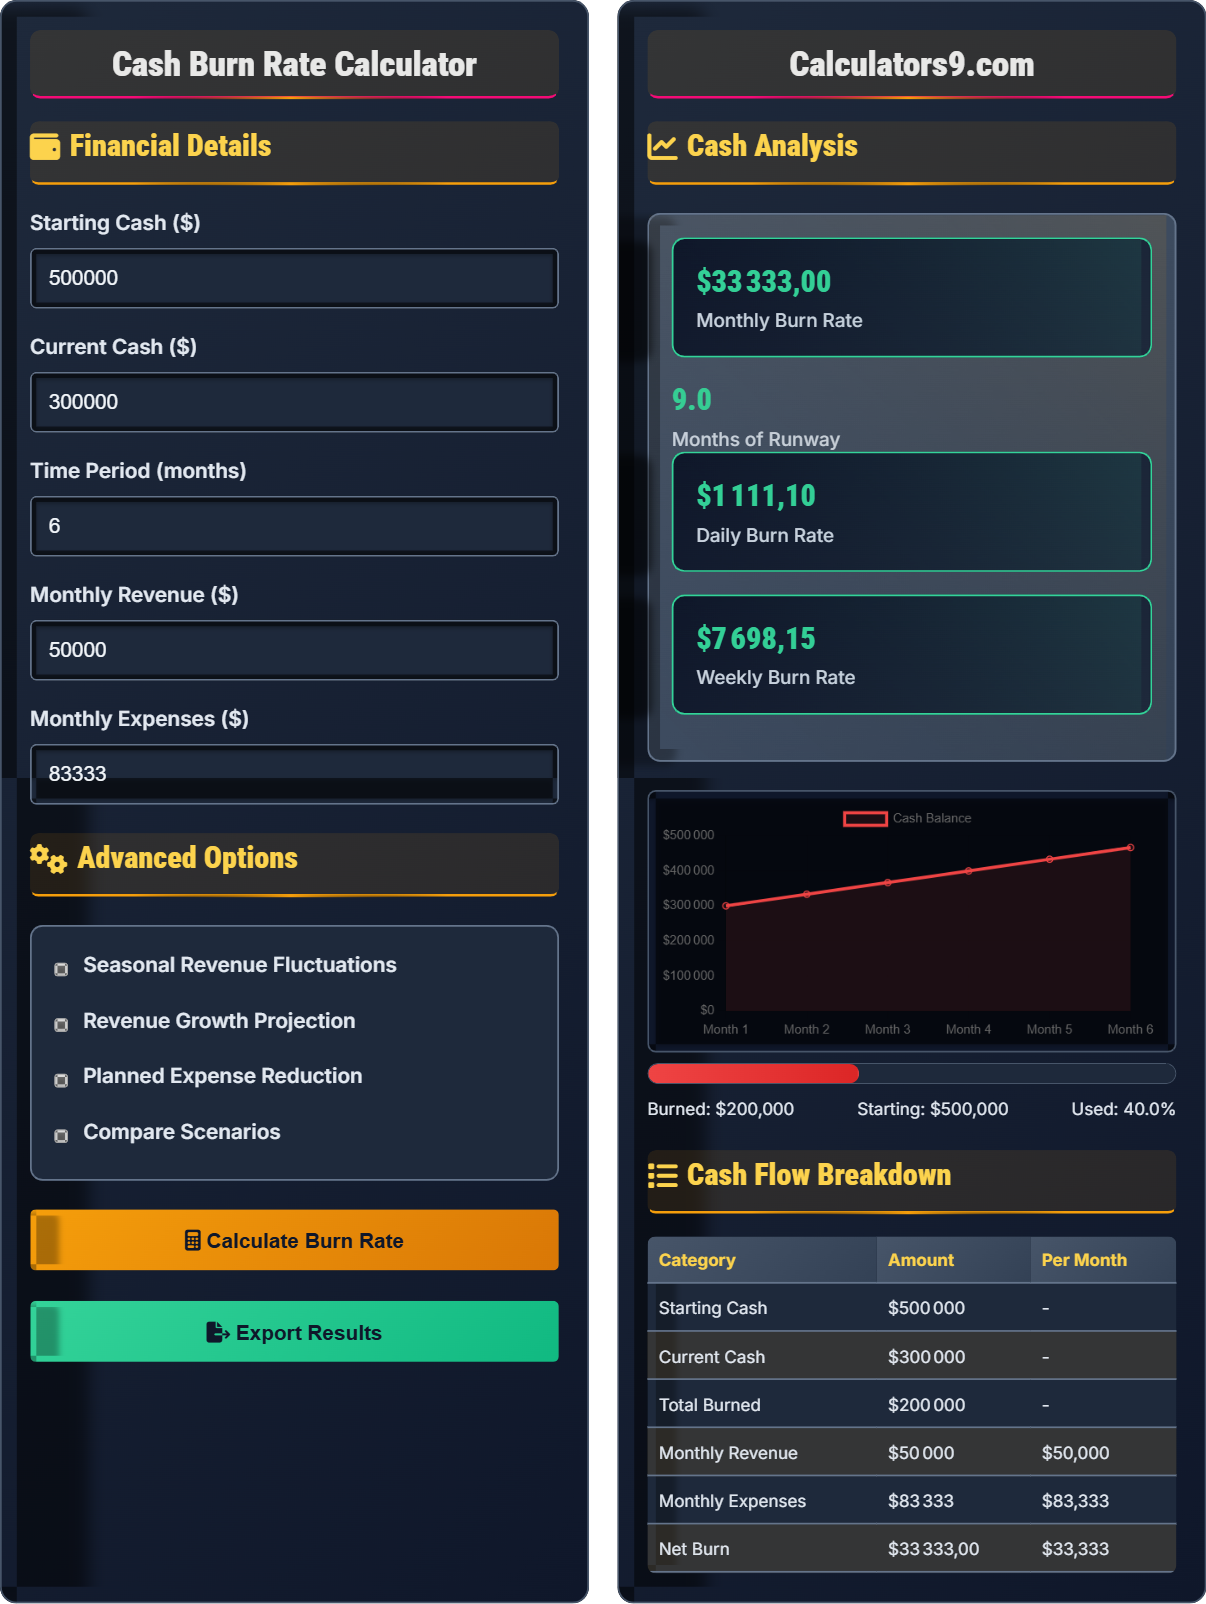
Example: Starting with $500,000 and ending with $300,000 after 6 months:
- Cash Burn Rate = ($500,000 - $300,000) ÷ 6 months
- Cash Burn Rate = $200,000 ÷ 6 = $33,333/month
- Cash Runway = $300,000 ÷ $33,333 = 9 months
So the company burns $33,333 monthly with 9 months of runway remaining.
Financial Details
Advanced Options
Cash Analysis
Cash Flow Breakdown
| Category | Amount | Per Month |
|---|---|---|
| Starting Cash | $500,000 | - |
| Current Cash | $300,000 | - |
| Total Burned | $200,000 | - |
| Monthly Revenue | $50,000 | $50,000 |
| Monthly Expenses | $83,333 | $83,333 |
| Net Burn | $33,333 | $33,333 |
Comprehensive Cash Management Guide
Cash burn rate is the rate at which a company uses up its cash reserves during a specific period, typically measured monthly. It's a critical metric for startups and businesses with negative cash flow, indicating how quickly they're depleting their financial resources. Understanding your burn rate helps predict how long you can operate before needing additional funding or achieving profitability.
The cash burn rate calculation determines your consumption rate:
Where:
- Starting Cash = Cash at beginning of period
- Ending Cash = Cash at end of period
- Time Period = Duration of measurement (months)
How different burn rates affect your runway with $300,000 current cash:
| Monthly Burn Rate | Runway (months) | Runway (weeks) |
|---|---|---|
| $20,000 | 15.0 | 65 |
| $25,000 | 12.0 | 52 |
| $30,000 | 10.0 | 43 |
| $33,333 | 9.0 | 39 |
| $40,000 | 7.5 | 33 |
| $50,000 | 6.0 | 26 |
- Monitor Burn Rate Weekly: Track trends and adjust quickly
- Negotiate Payment Terms: Extend payables, accelerate receivables
- Right-Size Operations: Align expenses with revenue trajectory
- Improve Unit Economics: Increase revenue per customer
- Plan Ahead: Fundraise before running out of cash
Cash Management Basics
Rate at which a company consumes cash reserves during operations.
Burn Rate = (Starting Cash - Ending Cash) ÷ Time Period
Calculate monthly cash consumption for planning purposes.
- Monitor burn rate monthly
- Plan for 12-18 months of runway
- Reduce burn when approaching critical levels
Strategies
Plan cash usage to maximize operational time before requiring additional funding.
- Calculate current burn rate
- Determine cash runway
- Set target runway length
- Implement cost reduction measures
- Seasonal variations affect burn rate
- Growth investments may increase burn rate
- Market conditions impact revenue timing
- Operational efficiency affects cash efficiency
Cash Management Learning Quiz
What does a high cash burn rate indicate about a company?
The answer is B) Rapid consumption of cash reserves. A high cash burn rate indicates that a company is using up its cash quickly, which reduces the time it has before needing additional funding or achieving profitability.
Cash burn rate is a measure of cash consumption, not profitability or revenue generation. A high burn rate is concerning because it shortens the company's runway and increases urgency for achieving positive cash flow or securing additional funding. It's a critical metric for evaluating financial sustainability.
Cash Burn Rate: Rate of cash consumption over time
Cash Runway: Time until cash depletion
Positive Cash Flow: Revenue exceeds expenses
• High burn rate = shorter runway
• Burn rate should trend downward over time
• Monitor burn rate weekly for early warning signs
• Calculate burn rate monthly to track trends
• Compare burn rate to industry benchmarks
• Plan funding rounds before runway expires
• Confusing high burn rate with high growth
• Not tracking burn rate regularly enough
• Failing to account for seasonal variations
Calculate the monthly cash burn rate for a company that started with $800,000 in January and had $500,000 in March. Show your work.
Using the cash burn rate formula: Burn Rate = (Starting Cash - Ending Cash) ÷ Time Period
Where: Starting Cash = $800,000, Ending Cash = $500,000, Time Period = 2 months (Jan to Mar)
Step 1: Calculate total cash burned = $800,000 - $500,000 = $300,000
Step 2: Calculate monthly burn rate = $300,000 ÷ 2 months = $150,000/month
Therefore, the monthly cash burn rate is $150,000.
This calculation shows the average monthly cash consumption over the period. It's important to accurately calculate the time period (March - January = 2 months, not 3) to get the correct monthly rate. This rate helps predict future cash needs and runway.
Starting Cash: Cash balance at beginning of period
Ending Cash: Cash balance at end of period
Time Period: Duration over which burn is measured
• Count exact months, not month names
• Include all cash equivalents in calculations
• Calculate monthly rate for consistency
• Use accounting software for accurate cash tracking
• Calculate burn rate for different time periods
• Monitor burn rate trends over time
• Miscounting the number of months in the period
• Including non-cash items in calculations
• Forgetting to divide by time period
Startup ABC has $400,000 in cash and is burning $25,000 per month. If they can reduce their burn rate by 20% starting next month, how much longer will their cash last? What is the new runway in months?
Current runway: $400,000 ÷ $25,000 = 16 months
New burn rate: $25,000 × (1 - 0.20) = $25,000 × 0.80 = $20,000
New runway: $400,000 ÷ $20,000 = 20 months
Extension: 20 - 16 = 4 months longer
Therefore, reducing burn rate by 20% extends runway by 4 months to 20 months total.
This demonstrates the powerful impact of reducing cash burn rate on runway. A 20% reduction in burn rate results in a 25% increase in runway (4 additional months out of 16). This shows why expense control is critical for extending operational time without additional funding.
Cash Runway: Time until cash depletion at current burn rate
Runway Extension: Additional time gained by reducing burn rate
Expense Control: Managing and reducing operational costs
• Runway is inversely proportional to burn rate
• Small percentage reductions in burn rate have significant impact on runway
• Runway should be monitored continuously
• Focus on reducing the largest expense categories first
• Negotiate payment terms to extend payables
• Consider temporary salary reductions to preserve cash
• Assuming linear relationship between burn rate and runway
• Not accounting for the compounding effect of burn rate reduction
• Forgetting to verify that new burn rate is sustainable
Company XYZ currently burns $40,000 per month with $600,000 in cash. Their revenue is growing at 10% monthly while expenses grow at 5% monthly. What will their burn rate be in 6 months? What will their cash runway be at that time?
Step 1: Calculate revenue and expenses in 6 months
Current monthly revenue = $50,000 (assumed), expenses = $90,000
Revenue in 6 months = $50,000 × (1.10)^6 = $50,000 × 1.7716 = $88,580
Expenses in 6 months = $90,000 × (1.05)^6 = $90,000 × 1.3401 = $120,609
Step 2: Calculate new burn rate = $120,609 - $88,580 = $32,029
Step 3: Calculate cash consumed in 6 months (approximate)
Average burn over 6 months ≈ ($40,000 + $32,029) ÷ 2 = $36,015
Cash consumed ≈ $36,015 × 6 = $216,090
Remaining cash ≈ $600,000 - $216,090 = $383,910
Step 4: New runway = $383,910 ÷ $32,029 = 11.99 months
Therefore, burn rate will be $32,029 with 12 months of runway.
This calculation shows how improving unit economics (revenue growing faster than expenses) can significantly improve cash position. As the company's revenue growth outpaces expense growth, the burn rate decreases, extending the runway even further. This demonstrates the importance of focusing on profitable growth.
Unit Economics: Revenue and cost per unit of business activity
Profitable Growth: Growth where revenue increases faster than expenses
Cash Efficiency: How effectively cash generates revenue
• Growing revenue faster than expenses reduces burn rate
• Compound growth affects both revenue and expenses
• Monitor the gap between revenue and expense growth rates
• Focus on metrics that drive revenue growth
• Control variable expenses as revenue scales
• Monitor contribution margins closely
• Assuming expenses will grow proportionally with revenue
• Not accounting for the compounding effect of growth rates
• Forgetting to adjust for changing cash position over time
Which of the following is NOT a risk associated with high cash burn rates?
The answer is C) Increased investor confidence. High cash burn rates typically decrease investor confidence because they indicate rapid consumption of resources and potentially unsustainable business practices. Investors prefer companies with controlled burn rates and clear paths to profitability.
High burn rates signal several concerns to investors: potential inability to reach profitability before running out of cash, inefficient resource allocation, and lack of sustainable business model. Smart investors look for companies that demonstrate efficient use of capital and clear plans to achieve positive cash flow.
Investor Confidence: Trust in company's ability to succeed
Capital Efficiency: How effectively capital generates returns
Funding Risk: Risk of being unable to secure financing
• High burn rates reduce investor confidence
• Sustainable growth requires efficient capital use
• Investors prefer companies with clear path to profitability
• Demonstrate clear plan to reduce burn rate over time
• Show correlation between spending and growth metrics
• Maintain transparency about cash position and burn rate
• Assuming high burn rates impress investors
• Not explaining the rationale behind cash usage
• Failing to show path to improved efficiency
FAQ
Q: How often should I calculate and monitor my cash burn rate?
A: Calculate cash burn rate at least monthly, but many startups track it weekly. The frequency depends on your runway:
- 12+ months runway: Monthly monitoring sufficient
- 6-12 months runway: Bi-weekly monitoring
- Less than 6 months: Weekly monitoring essential
Formula: Current Burn Rate = (Cash Last Week - Cash This Week) ÷ 1 Week
More frequent monitoring allows for quicker course corrections when burn rate trends upward unexpectedly.
Q: What burn rate is considered acceptable for early-stage startups?
A: Acceptable burn rates vary by stage and sector:
- Seed Stage: $25,000 - $75,000 per month
- Series A: $50,000 - $150,000 per month
- Series B+: $100,000 - $300,000 per month
However, the key metric is burn rate efficiency: Revenue Generated ÷ Dollars Burned. Top performers generate $1.50-$3.00 in ARR for every dollar burned. The trend matters more than absolute numbers.