Annuity Payout Calculator
Retirement income planning • Sustainable withdrawals
Annuity Payout Formulas:
Show the calculatorPayout Amount: \( PMT = PV \times \frac{r(1+r)^n}{(1+r)^n - 1} \)
Remaining Balance: \( RB = PV \times (1+r)^n - PMT \times \frac{(1+r)^n - 1}{r} \)
Where:
- \( PMT \) = Periodic payout amount
- \( PV \) = Present value (initial investment)
- \( r \) = Interest rate per period
- \( n \) = Number of periods
- \( RB \) = Remaining balance
These formulas calculate the sustainable withdrawal amount from an annuity over a specified period while accounting for ongoing returns. The payout formula determines how much can be withdrawn regularly, while the remaining balance formula tracks how the principal changes over time.
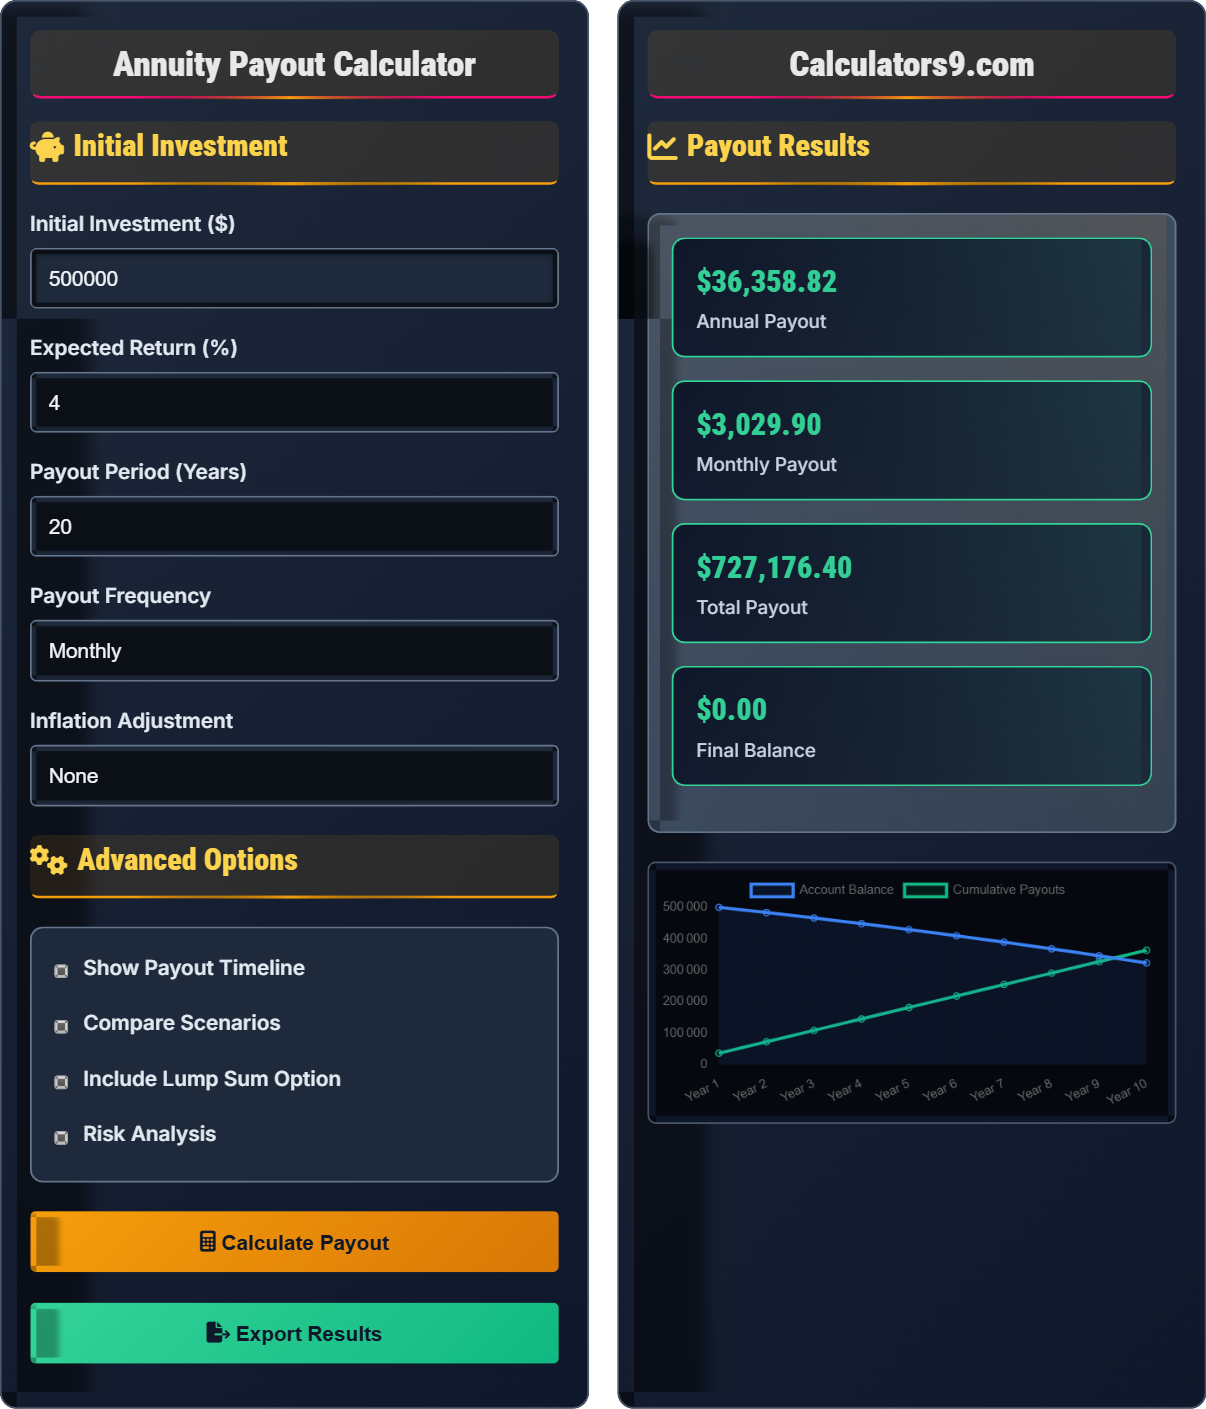
Example: For an initial investment of $500,000 earning 4% annually over 20 years:
Annual payout: \( PMT = 500,000 \times \frac{0.04(1+0.04)^{20}}{(1+0.04)^{20} - 1} \approx \$36,791 \)
Thus, the sustainable annual withdrawal would be approximately $36,791.
Initial Investment
Advanced Options
Payout Results
| Year | Starting Balance | Payout | Ending Balance |
|---|
| Scenario | Annual Payout | Monthly Payout |
|---|
Comprehensive Annuity Payout Guide
An annuity payout is a systematic withdrawal plan from an investment account designed to provide regular income during retirement. Unlike accumulation annuities that build value, payout annuities distribute funds over time. The goal is to balance regular income with preservation of capital for as long as possible.
The standard payout calculation uses this formula:
Where:
- \(PMT\) = Periodic payout amount
- \(PV\) = Present value (initial investment)
- \(r\) = Interest rate per period
- \(n\) = Number of periods
Critical factors affecting payout sustainability:
- Withdrawal Rate: Higher rates deplete principal faster
- Market Returns: Affects portfolio growth during payout phase
- Inflation: Erodes purchasing power over time
- Life Expectancy: Determines required payout duration
- Tax Implications: Affects net income received
- 4% Rule: Withdraw 4% of initial portfolio annually, adjusted for inflation
- Dynamic Spending: Adjust withdrawals based on portfolio performance
- Required Minimum Distributions: Account for IRS rules on retirement accounts
- Social Security Coordination: Optimize claiming strategies
- Healthcare Planning: Account for potentially high medical costs
Payout Fundamentals
Systematic withdrawal from investment account during retirement.
\(PMT = PV \times \frac{r(1+r)^n}{(1+r)^n - 1}\)
Where PMT=payout, PV=investment, r=rate, n=periods.
- Higher returns = higher sustainable payouts
- Longer periods = lower annual payouts
- Inflation reduces real purchasing power
Strategies
Balance between income needs and capital preservation.
- Start with conservative withdrawal rate
- Adjust for market conditions
- Factor in inflation protection
- Maintain diversification
- Life expectancy planning
- Healthcare costs
- Tax efficiency
- Legacy planning
Annuity Payout Learning Quiz
Which of the following factors would result in the highest sustainable annual payout from a $500,000 retirement account over 20 years?
The answer is C) 4% annual return, 15-year payout period. Using the payout formula \(PMT = PV \times \frac{r(1+r)^n}{(1+r)^n - 1}\), a shorter payout period allows for higher annual payments. With $500,000 at 4% over 15 years, the annual payout would be approximately $45,300, which is higher than the other options.
This question demonstrates the inverse relationship between payout period and annual payment amount. When you have fewer years to distribute the same principal, each annual payment can be larger. However, this comes with the risk of running out of money sooner if you live beyond the planned period.
Sustainable Withdrawal: Annual amount that can be taken from portfolio without depleting it prematurely
Safe Withdrawal Rate: Percentage of portfolio that can be withdrawn annually with high probability of success
Longevity Risk: Risk of outliving one's assets
• Shorter payout periods allow higher annual payments
• Higher returns enable greater sustainable withdrawals
• Larger initial investments support higher payouts
• Use the payout formula: PMT = PV × [r(1+r)^n]/[(1+r)^n - 1]
• Consider life expectancy when setting payout periods
• Factor in inflation when planning long-term payouts
• Assuming longer payout periods allow higher annual payments
• Not accounting for inflation in long-term planning
• Overlooking the impact of returns on sustainable withdrawals
Calculate the monthly payout from a $750,000 retirement account earning 3.5% annually over 25 years. Show your work.
Using the payout formula: \(PMT = PV \times \frac{r(1+r)^n}{(1+r)^n - 1}\)
Given:
- PV = $750,000
- r = 0.035 ÷ 12 = 0.002917 (monthly rate)
- n = 25 × 12 = 300 (months)
Step 1: Calculate (1+r)^n = (1.002917)^300 = 2.3632
Step 2: Calculate numerator: r(1+r)^n = 0.002917 × 2.3632 = 0.006894
Step 3: Calculate denominator: (1+r)^n - 1 = 2.3632 - 1 = 1.3632
Step 4: Calculate PMT = $750,000 × (0.006894/1.3632) = $750,000 × 0.005057 = $3,793.00
Therefore, the monthly payout is approximately $3,793.
This calculation demonstrates how to adapt the payout formula for different time periods. The key is converting the annual rate to a monthly rate and the time period to months. The monthly payout of $3,793 provides $45,516 annually, which represents about 6.1% of the initial investment spread over 25 years.
Periodic Rate: Interest rate applied per payment period
Amortization: Process of spreading payments over time
Present Value: Current worth of future cash flows
• Always match the interest rate period with the payment frequency
• Convert time periods to match payment frequency
• The formula balances principal depletion with interest earnings
• Remember: r = annual rate ÷ payment frequency
• Remember: n = years × payment frequency
• Use a calculator for complex exponent calculations
• Forgetting to convert annual rates to monthly rates
• Using the wrong number of periods (not adjusting for frequency)
• Making calculation errors with large exponents
Robert has $1 million in retirement savings and wants to withdraw money for 30 years. His basic annual payout is $45,000, but he wants to adjust for 2.5% annual inflation. What will his payout be in year 10? How much total will he have received by then?
For inflation-adjusted payouts, each year's payment equals the previous year's payment multiplied by (1 + inflation rate).
Year 10 payout: $45,000 × (1.025)^9 = $45,000 × 1.2489 = $56,200
To find total received by year 10, we calculate the sum of a geometric series:
Total = $45,000 × [(1.025^10 - 1) / 0.025] = $45,000 × 11.2034 = $504,153
Therefore, Robert's 10th year payout will be $56,200, and he will have received $504,153 in total by then.
This problem shows how inflation adjustments compound over time. The payout increases geometrically, not linearly. By year 10, Robert's income will be 25% higher than the initial amount to maintain purchasing power. This adjustment is crucial for long-term retirement planning as it preserves buying power despite rising costs.
Inflation Adjustment: Increasing payments to maintain purchasing power
Geometric Series: Sequence where each term is multiplied by a constant factor
Purchasing Power: Amount of goods/services that can be bought with currency
• Inflation-adjusted payments grow geometrically
• For inflation-adjusted payments: Year N = Initial × (1 + inflation)^(N-1)
• Use geometric series formula for total calculations
• Plan for increasing expenses over long retirement periods
• Calculating inflation as simple addition instead of multiplication
• Forgetting to adjust for the correct number of periods
• Not accounting for compounding effect of inflation adjustments
Maria has $800,000 in retirement savings and plans to withdraw $40,000 annually for 25 years. She's concerned about market volatility. If her portfolio experiences a 15% decline in the first year, how much could she safely withdraw annually for the remaining 24 years assuming the same 4% expected return? (Hint: Recalculate the payout with the reduced principal)
Step 1: Calculate reduced principal after 15% decline = $800,000 × 0.85 = $680,000
Step 2: Apply payout formula for remaining 24 years at 4% return:
With PV=$680,000, r=0.04, n=24:
(1+r)^n = (1.04)^24 = 2.5633
Numerator: r(1+r)^n = 0.04 × 2.5633 = 0.1025
Denominator: (1+r)^n - 1 = 2.5633 - 1 = 1.5633
New annual payout = $680,000 × (0.1025/1.5633) = $680,000 × 0.0656 = $44,588
However, since she already withdrew $40,000, her sustainable annual withdrawal for the remaining 24 years is $44,588.
This example illustrates sequence of returns risk - how poor early returns can significantly impact sustainable withdrawal amounts. Maria's portfolio declined by $120,000 in the first year, but the impact on her sustainable withdrawal rate is complex. The recovery in subsequent years, assuming a 4% return, allows for a higher sustainable withdrawal than her original $40,000, but this assumes consistent positive returns going forward.
Sequence of Returns Risk: Risk that negative returns early in retirement will harm portfolio longevity
Portfolio Rebalancing: Adjusting asset allocation after market movements
Dynamic Withdrawal: Adjusting spending based on portfolio performance
• Early market losses disproportionately affect retirement portfolios
• Recovery rates depend on future returns and withdrawal levels
• Flexible withdrawal strategies can mitigate sequence risk
• Maintain a cash buffer for early retirement years
• Consider reducing withdrawals during market downturns
• Use a floor and ceiling approach for withdrawal flexibility
• Not accounting for sequence of returns risk in planning
• Assuming constant returns throughout retirement
• Failing to adjust withdrawal strategies after market events
Which combination would provide the most sustainable retirement income for a $600,000 portfolio over 20 years?
The answer is C) 4% return, 4% annual withdrawal rate. This combination has the best sustainability ratio (return rate equal to withdrawal rate), ensuring the portfolio maintains its value in real terms. While option B appears to have a good return-to-withdrawal ratio, a 6% withdrawal rate from a 5% returning portfolio is likely to deplete assets over 20 years.
For sustainable withdrawals, the withdrawal rate should be conservative relative to expected returns. The classic "4% rule" suggests withdrawing 4% initially and adjusting for inflation. A 4% withdrawal rate with 4% returns means the portfolio's principal remains stable in real terms. Higher withdrawal rates relative to returns will eventually deplete the portfolio.
Safe Withdrawal Rate: Annual percentage that can be withdrawn with high probability of success
Portfolio Longevity: Ability of portfolio to sustain withdrawals over time
Capital Preservation: Maintaining portfolio value over time
• Withdrawal rates should be conservative relative to expected returns
• Higher returns support higher sustainable withdrawal rates
• The 4% rule is a widely accepted starting point
• Consider a range of 3-5% as safe withdrawal rates
• Reduce withdrawals during market downturns
• Plan for flexible spending in retirement
• Assuming all portfolios can sustain high withdrawal rates
• Not accounting for market volatility in planning
• Ignoring the impact of sequence of returns risk
FAQ
Q: How do I determine a safe withdrawal rate for my retirement portfolio?
A: The "safe" withdrawal rate depends on your portfolio composition, time horizon, and risk tolerance. The traditional 4% rule suggests withdrawing 4% of your initial portfolio value annually, adjusted for inflation.
Using the payout formula: \( PMT = PV \times \frac{r(1+r)^n}{(1+r)^n - 1} \), for a $500,000 portfolio at 4% return over 25 years, the annual payout would be approximately $32,000, or 6.4% of the initial value. However, research suggests 3-5% is safer depending on market conditions.
Factors to consider:
- Portfolio allocation (stocks vs bonds)
- Expected market returns
- Retirement duration
- Flexibility to adjust spending
Q: Should I choose a fixed annuity or systematic withdrawals?
A: The choice depends on your priorities:
- Fixed Annuity: Guarantees income for life, eliminating longevity risk. For example, a $500,000 annuity at age 65 might provide $2,500-3,000/month for life.
- Systematic Withdrawals: Uses the payout formula \( PMT = PV \times \frac{r(1+r)^n}{(1+r)^n - 1} \). Offers flexibility and potential for growth. A $500,000 portfolio at 4% return over 20 years yields about $3,065/month.
Many experts recommend a hybrid approach: secure a base level of income with annuities, then supplement with systematic withdrawals from a diversified portfolio.