Average Return Calculator
Investment performance • Portfolio analysis
Average Return Formulas:
Show the calculatorArithmetic Mean: \( AM = \frac{1}{n} \sum_{i=1}^{n} R_i \)
Geometric Mean: \( GM = \sqrt[n]{\prod_{i=1}^{n} (1 + R_i)} - 1 \)
Time-Weighted Return: \( TWR = \prod_{i=1}^{n} (1 + R_i) - 1 \)
Money-Weighted Return (IRR): \( \sum_{t=0}^{n} \frac{CF_t}{(1+IRR)^t} = 0 \)
Where:
- \( AM \) = Arithmetic Mean Return
- \( GM \) = Geometric Mean Return
- \( TWR \) = Time-Weighted Return
- \( R_i \) = Return for period i
- \( n \) = Number of periods
- \( CF_t \) = Cash flow at time t
These formulas calculate different types of average returns used in investment analysis. Arithmetic mean is simple average, geometric mean accounts for compounding, time-weighted return removes cash flow timing effects, and money-weighted return considers cash flow timing.
Example: For annual returns of 10%, -5%, 15%, and 8% over 4 years:
Arithmetic Mean: (10 - 5 + 15 + 8) / 4 = 7.0%
Geometric Mean: √[(1.10 × 0.95 × 1.15 × 1.08)^(1/4)] - 1 ≈ 6.8%
Geometric mean better reflects actual investment growth.
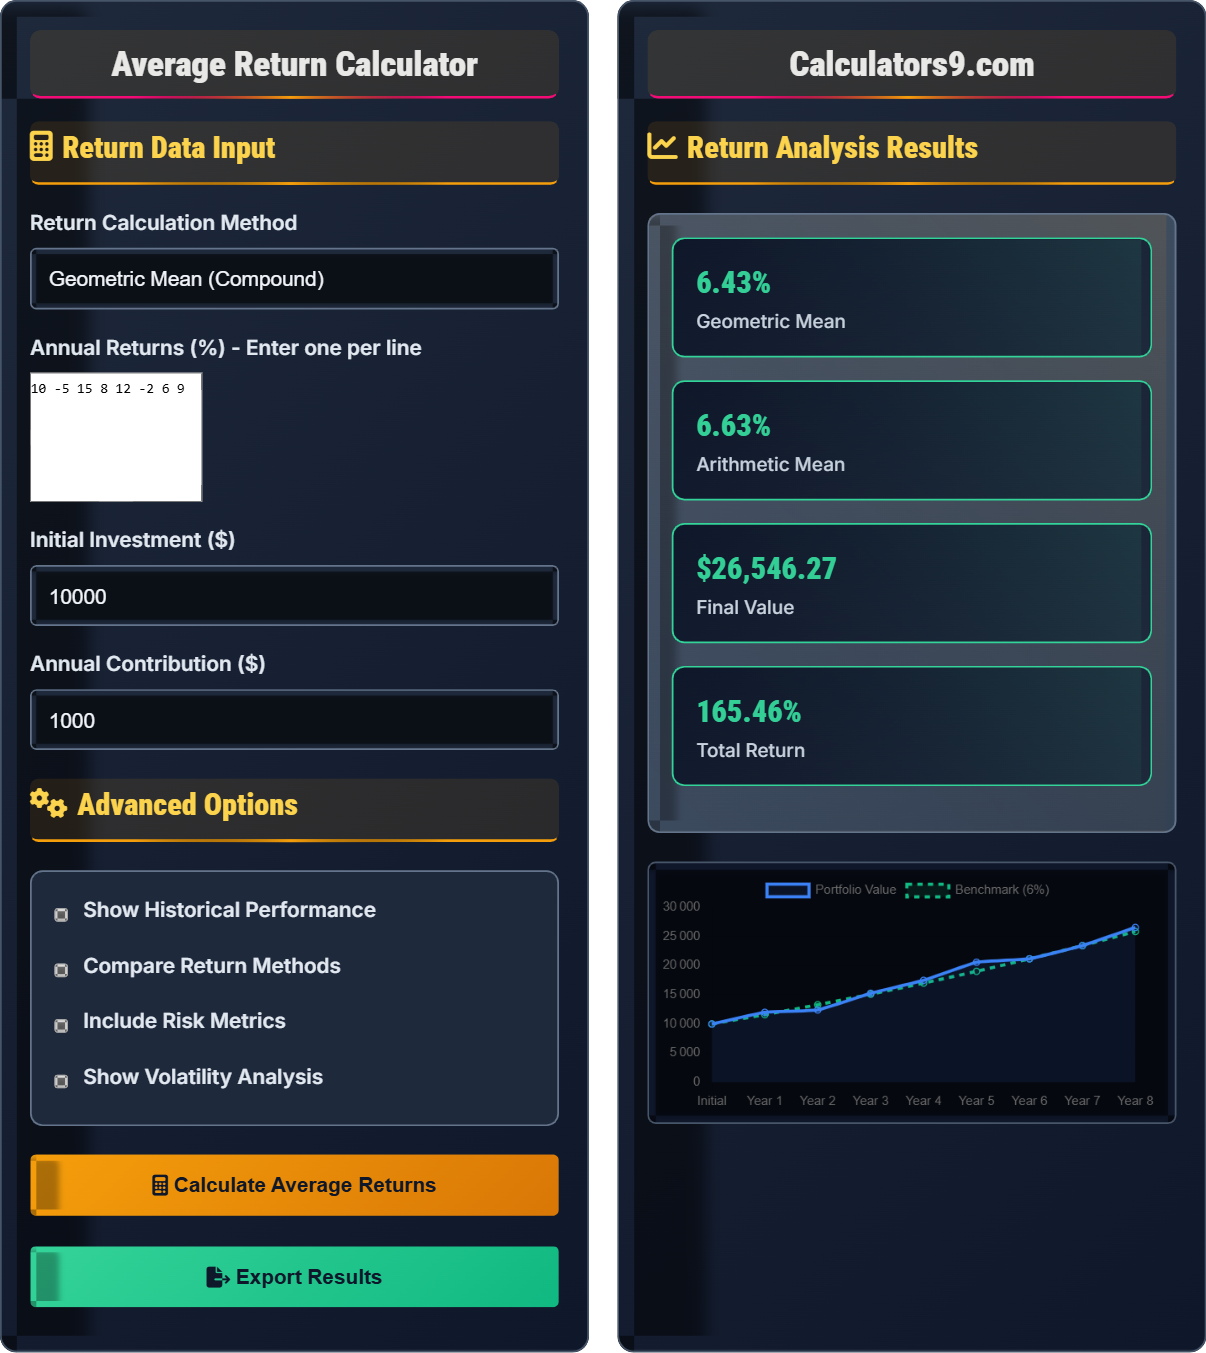
Return Data Input
Advanced Options
Return Analysis Results
| Year | Return (%) | Value | Contribution |
|---|
| Metric | Value | Explanation |
|---|
Comprehensive Average Return Guide
Average returns measure the central tendency of investment performance over time. Different methods of calculating averages provide different insights into investment performance. The choice of method depends on the purpose of the analysis and the nature of the investment returns.
The standard return calculation methods use these formulas:
Where:
- \(AM\) = Arithmetic Mean Return
- \(GM\) = Geometric Mean Return
- \(R_i\) = Return for period i
- \(n\) = Number of periods
Key advantages of return analysis include:
- Performance Measurement: Quantify investment success
- Comparison Tool: Benchmark against indices or peers
- Decision Support: Inform investment choices
- Risk Assessment: Understand volatility patterns
- Goal Tracking: Monitor progress toward targets
- Use Geometric Mean: For measuring actual investment growth
- Consider Time Period: Longer periods smooth volatility
- Adjust for Risk: Compare returns relative to risk taken
- Account for Inflation: Real returns matter more than nominal
- Look Beyond Averages: Consider distribution of returns
Average Return Fundamentals
Methods to measure investment performance over time.
\(AM = \frac{1}{n} \sum_{i=1}^{n} R_i\)
\(GM = \sqrt[n]{\prod_{i=1}^{n} (1 + R_i)} - 1\)
Where AM=arithmetic mean, GM=geometric mean, Ri=returns, n=periods.
- Geometric mean reflects actual compound growth
- Arithmetic mean can overestimate performance
- More volatile returns create greater difference between methods
Strategies
Quantifying investment success with appropriate metrics.
- Determine appropriate return calculation method
- Collect accurate historical return data
- Calculate both arithmetic and geometric means
- Consider risk-adjusted performance measures
- Geometric mean is more accurate for growth measurement
- Time-weighted returns eliminate cash flow effects
- Money-weighted returns reflect actual investor experience
- Consider benchmark comparisons
Average Return Analysis Learning Quiz
Which return calculation method best represents actual compound growth of an investment?
The answer is B) Geometric Mean. The geometric mean accounts for compounding and provides the actual rate of return that would result in the same final value as the sequence of returns. Using the formula \(GM = \sqrt[n]{\prod_{i=1}^{n} (1 + R_i)} - 1\), it properly weights the effect of returns over time.
This question addresses a fundamental concept in investment analysis. While arithmetic mean is the simple average of returns, geometric mean accounts for the compounding effect that occurs when returns are reinvested. For example, if an investment loses 50% one year and gains 50% the next, the arithmetic mean is 0%, but the geometric mean shows the actual loss (since 0.5 × 1.5 = 0.75, or a 25% loss).
Geometric Mean: Average that accounts for compounding effects
Arithmetic Mean: Simple average of returns
Compound Growth: Growth that builds on previous growth
• Geometric mean is always ≤ arithmetic mean (when returns vary)
• Geometric mean reflects actual investment growth path
• Arithmetic mean is appropriate for expected future returns
• Use geometric mean for historical performance
• Use arithmetic mean for expected future returns
• The difference increases with return volatility
• Using arithmetic mean instead of geometric mean for performance
• Not understanding the compounding effect
• Confusing different return calculation methods
Calculate both the arithmetic and geometric mean for these annual returns: 10%, -5%, 15%, 8%. Show your work.
Arithmetic Mean: (10 + (-5) + 15 + 8) / 4 = 28 / 4 = 7.0%
Geometric Mean: \(GM = \sqrt[4]{(1.10 × 0.95 × 1.15 × 1.08)} - 1\)
Step 1: Calculate the product: 1.10 × 0.95 × 1.15 × 1.08 = 1.283
Step 2: Take the 4th root: ∜1.283 = 1.064
Step 3: Subtract 1: 1.064 - 1 = 0.064 = 6.4%
Therefore, arithmetic mean = 7.0% and geometric mean = 6.4%.
This calculation demonstrates the difference between arithmetic and geometric means. The geometric mean (6.4%) is lower than the arithmetic mean (7.0%) due to the compounding effect of the negative return. When returns are volatile, the geometric mean provides a more accurate representation of actual investment growth.
Arithmetic Mean: Sum of returns divided by number of periods
Geometric Mean: nth root of product of (1 + returns)
Compounding Effect: Impact of returns building on previous returns
• Convert percentages to decimals for calculations
• Add 1 to each return for geometric mean
• Take nth root where n is number of periods
• Always convert percentages to decimals for formulas
• Add 1 to returns when multiplying for geometric mean
• Use a calculator for nth roots
• Forgetting to convert percentages to decimals
• Not adding 1 to returns for geometric mean
• Using wrong root for geometric mean calculation
An investor had a portfolio that returned 25% in year 1, lost 20% in year 2, and gained 15% in year 3. Calculate the geometric mean return and explain why it differs from the arithmetic mean. What was the total return over the 3-year period?
Arithmetic Mean: (25 + (-20) + 15) / 3 = 20 / 3 = 6.67%
Geometric Mean: \(GM = \sqrt[3]{(1.25 × 0.80 × 1.15)} - 1\)
Step 1: Calculate the product: 1.25 × 0.80 × 1.15 = 1.15
Step 2: Take the cube root: ∛1.15 = 1.0477
Step 3: Subtract 1: 1.0477 - 1 = 0.0477 = 4.77%
Total Return: (1.25 × 0.80 × 1.15) - 1 = 1.15 - 1 = 0.15 = 15%
The geometric mean (4.77%) is lower than arithmetic (6.67%) due to volatility.
This example demonstrates how volatility reduces compound growth. Even though the arithmetic average is positive, the geometric mean is lower due to the compounding effect of the negative return. The 20% loss in year 2 required a 25% gain just to break even, illustrating how losses have a disproportionate impact on compound growth.
Volatility Drag: Reduction in compound growth due to return variability
Loss Recovery: Higher return needed to recover from losses
Compound Growth Path: Actual growth trajectory of investment
• Losses require larger gains to recover
• Volatile returns reduce geometric mean
• Geometric mean reflects actual growth path
• Remember: losing 20% requires 25% gain to break even
• More volatile returns create greater difference between means
• Geometric mean is always lower when returns vary
• Assuming arithmetic mean represents actual growth
• Not understanding the impact of volatility
• Forgetting that geometric mean accounts for compounding
Two investments have the same arithmetic mean return of 10% over 5 years, but different volatilities. Investment A has returns of 10%, 10%, 10%, 10%, 10%. Investment B has returns of 20%, 0%, 20%, 0%, 10%. Calculate the geometric mean for each and explain which investment performed better in terms of actual growth. (Hint: Consider volatility's impact on compound growth)
Investment A: All returns are 10% (0% volatility)
Geometric Mean: \(GM = \sqrt[5]{(1.10)^5} - 1 = 1.10 - 1 = 0.10 = 10%\)
Investment B: Returns vary significantly (high volatility)
Geometric Mean: \(GM = \sqrt[5]{1.20 × 1.00 × 1.20 × 1.00 × 1.10} - 1\)
Step 1: Product = 1.20 × 1.00 × 1.20 × 1.00 × 1.10 = 1.584
Step 2: 5th root of 1.584 = 1.0975
Step 3: 1.0975 - 1 = 0.0975 = 9.75%
Investment A performed better with 10% geometric mean vs 9.75% for Investment B.
This demonstrates the concept of "volatility drag" - how return variability reduces compound growth even when arithmetic means are identical. Investment A's consistent returns resulted in a geometric mean equal to the arithmetic mean. Investment B's volatile returns reduced the geometric mean below the arithmetic mean, showing that volatility erodes compound growth potential.
Volatility Drag: Reduction in compound growth due to return variability
Return Variability: Degree of fluctuation in investment returns
Compound Growth Erosion: Reduction in growth due to volatility
• Higher volatility reduces geometric mean return
• Consistent returns maximize compound growth
• Same arithmetic mean doesn't guarantee same growth
• Lower volatility preserves compound growth
• Consistency in returns is valuable
• Consider standard deviation alongside returns
• Ignoring the impact of volatility on compound growth
• Assuming equal arithmetic means mean equal growth
• Not considering risk-adjusted returns
What is the main difference between time-weighted return and money-weighted return?
The answer is A) Time-weighted ignores cash flows, money-weighted considers them. Time-weighted return measures the manager's performance by removing the effect of external cash flows, while money-weighted return (IRR) considers the timing and amount of cash flows, reflecting the actual investor experience.
This question addresses two important return calculation methodologies. Time-weighted return is preferred for evaluating portfolio managers because it isolates their investment decisions from the effects of client cash flows. Money-weighted return is more relevant for individual investors as it reflects the actual return earned on their invested capital given their timing of contributions and withdrawals.
Time-Weighted Return: Measures performance independent of cash flows
Money-Weighted Return: Reflects actual investor experience with cash flows
Internal Rate of Return (IRR): Discount rate that makes NPV equal to zero
• Time-weighted return eliminates cash flow timing effects
• Money-weighted return reflects investor timing skills
• Both methods are valid for different purposes
• Use time-weighted for manager evaluation
• Use money-weighted for personal portfolio analysis
• Both methods help understand different aspects of performance
• Confusing the purposes of different return methods
• Using the wrong method for the intended analysis
• Not understanding the impact of cash flows
FAQ
Q: Why is geometric mean different from arithmetic mean in investment returns?
A: The difference stems from how they handle compounding. The arithmetic mean is simply the sum of returns divided by the number of periods: \( AM = \frac{1}{n} \sum_{i=1}^{n} R_i \).
The geometric mean accounts for the compounding effect: \( GM = \sqrt[n]{\prod_{i=1}^{n} (1 + R_i)} - 1 \).
For example, with returns of 10% and -10%: Arithmetic mean = 0%, but Geometric mean = √[(1.10)(0.90)] - 1 = √0.99 - 1 = -0.5%. The geometric mean shows the actual loss due to volatility.
Q: When should I use time-weighted vs money-weighted returns?
A: Use time-weighted returns to evaluate investment manager performance, as it removes the impact of cash flows: \( TWR = \prod_{i=1}^{n} (1 + R_i) - 1 \).
Use money-weighted returns (IRR) to assess your personal investment experience, as it considers the timing of your contributions and withdrawals. The IRR solves: \( \sum_{t=0}^{n} \frac{CF_t}{(1+IRR)^t} = 0 \).
For example, if you invested poorly-timed amounts, your IRR might be lower than the fund's time-weighted return.