Dividend Calculator
Dividend yield & growth calculator • 2026 analysis
Stock Details
Advanced Options
Results
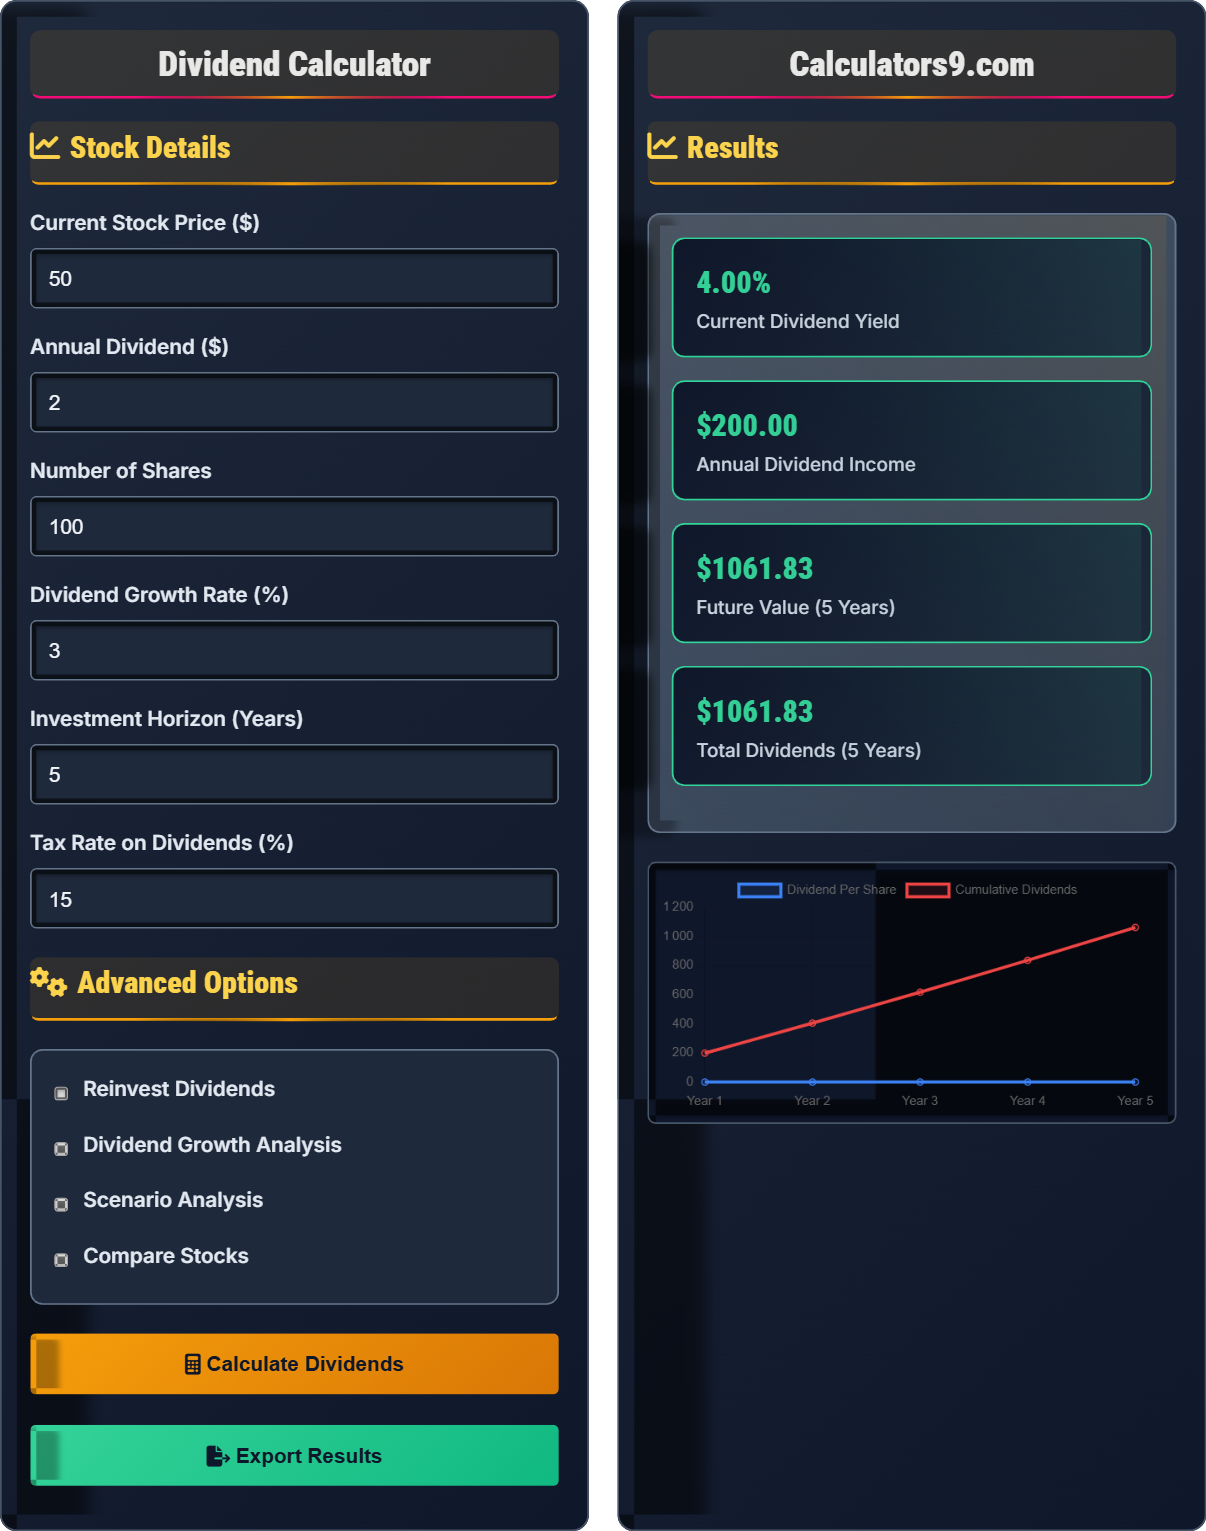
| Year | Dividend Per Share | Annual Dividend | After-Tax Income | Cumulative Dividends |
|---|
| Metric | Value | Interpretation |
|---|
Comprehensive Dividend Guide
Dividend yield is a financial ratio that shows how much a company pays out in dividends each year relative to its stock price. It's calculated as Annual Dividends Per Share divided by Stock Price. This metric helps investors determine how much income they can expect from their investment relative to the price they paid. A higher dividend yield typically indicates a better income-generating investment, though it's important to consider the sustainability of the dividend.
The key dividend calculations include:
Key considerations for dividend investing:
- Dividend Yield: Current income generation capability
- Payout Ratio: Sustainability of dividend payments
- Dividend Growth: Historical growth trend
- Company Fundamentals: Financial health and earnings stability
- Tax Implications: Qualified vs non-qualified dividend treatment
- Dollar-Cost Averaging: Invest fixed amounts regularly to smooth volatility
- Dividend Reinvestment: Automatically reinvest dividends for compounding
- Dividend Growth Focus: Target stocks with growing dividend history
- Portfolio Diversification: Spread across sectors and industries
- Tax Optimization: Consider tax implications of dividend income
Dividend Learning Quiz
If a stock trades at $100 and pays an annual dividend of $4, what is its dividend yield?
The answer is B) 4%. Dividend yield is calculated as (Annual Dividend ÷ Stock Price) × 100. So ($4 ÷ $100) × 100 = 0.04 × 100 = 4%. This means for every $100 invested, you receive $4 in annual dividend income.
Dividend yield is a percentage that represents the annual dividend income relative to the stock price. It's a standardized way to compare the income potential of different stocks regardless of their price. A 4% yield means you earn $4 per year for every $100 invested in the stock.
Dividend Yield: Annual dividend income as percentage of stock price
Annual Dividend: Total dividends paid per share in one year
Relative Measure: Compares income potential across different priced stocks
• Yield = (Annual Dividend ÷ Stock Price) × 100
• Higher yield = Higher income potential
• Consider dividend sustainability along with yield
• Remember: Yield = Income ÷ Price
• Higher yields may indicate higher risk
• Check dividend history for sustainability
• Confusing dividend yield with stock return
• Assuming high yield always equals safe investment
• Not considering dividend sustainability
If a company currently pays $2.00 per share annually and grows its dividend at 5% per year, what will the dividend be in 3 years? Show your work.
Using the compound growth formula: Future Dividend = Current Dividend × (1 + Growth Rate)^t
Given:
- Current Dividend: $2.00
- Growth Rate: 5% or 0.05
- Time: 3 years
Year 1: $2.00 × (1.05)^1 = $2.00 × 1.05 = $2.10
Year 2: $2.00 × (1.05)^2 = $2.00 × 1.1025 = $2.21
Year 3: $2.00 × (1.05)^3 = $2.00 × 1.1576 = $2.32
Or calculated directly: $2.00 × (1.05)^3 = $2.32
The dividend will be $2.32 per share in 3 years.
This demonstrates the power of compound growth in dividend investing. Even at a modest 5% growth rate, the dividend increases by 16% over 3 years. This compounding effect becomes more pronounced over longer periods, making dividend growth stocks attractive for long-term investors.
Dividend Growth: Annual increase in dividend payments
Compound Growth: Growth on previous growth (exponential)
Future Value: Value after growth over time period
• Use exponential growth formula for dividend projections
• Growth compounds annually
• Small growth rates have significant long-term impact
• Use calculator for compound growth
• Consider historical growth rates
• Sustainable growth is more valuable than rapid growth
• Calculating simple growth instead of compound growth
• Assuming past growth continues indefinitely
• Not considering company's ability to sustain growth
You own 200 shares of a stock that pays $1.50 per share quarterly. What is your annual dividend income? If the dividend grows by 4% annually, what will your income be in 5 years?
Step 1: Calculate current annual income
• Quarterly dividend per share: $1.50
• Annual dividend per share: $1.50 × 4 = $6.00
• Annual income for 200 shares: $6.00 × 200 = $1,200
Step 2: Calculate income in 5 years with 4% growth
• Future annual dividend per share: $6.00 × (1.04)^5
• (1.04)^5 = 1.2167
• Future dividend per share: $6.00 × 1.2167 = $7.30
• Future annual income: $7.30 × 200 = $1,460
Your current annual income is $1,200, which will grow to $1,460 in 5 years with 4% annual growth.
This example shows how dividend growth can significantly increase your income over time. Your income increases from $1,200 to $1,460 over 5 years, representing a 21.7% increase. This demonstrates the power of dividend growth investing, where both the number of shares and dividend per share can contribute to increasing income.
Quarterly Dividend: Paid every 3 months
Annual Income: Total dividends received in one yearCompounded Growth: Growth applied to previous year's amount
• Quarterly × 4 = Annual dividend
• Total income = Dividend per share × Number of shares
• Future value includes compound growth
• Convert quarterly to annual for easier calculations
• Consider reinvestment for compound growth
• Track both yield and growth potential
• Forgetting to multiply quarterly by 4
• Not accounting for compound growth
• Confusing dividend per share with total income
You own 500 shares of a stock with a $3.00 annual dividend. If qualified dividends are taxed at 15% and ordinary income at 22%, how much more would you keep after taxes if dividends are qualified?
Step 1: Calculate total annual dividend income
• Total income: $3.00 × 500 = $1,500
Step 2: Calculate tax at qualified rate (15%)
• Tax: $1,500 × 0.15 = $225
• After-tax income: $1,500 - $225 = $1,275
Step 3: Calculate tax at ordinary rate (22%)
• Tax: $1,500 × 0.22 = $330
• After-tax income: $1,500 - $330 = $1,170
Step 4: Calculate difference
• Difference: $1,275 - $1,170 = $105
You would keep $105 more after taxes if dividends are qualified instead of ordinary income.
This demonstrates the significant impact of tax classification on dividend income. The difference between qualified (15%) and ordinary (22%) tax rates results in a 7% difference in the tax burden, saving $105 on $1,500 of dividend income. This is why tax-efficient investing strategies are important for dividend-focused portfolios.
Qualified Dividends: Taxed at capital gains rates (lower)
Ordinary Income: Taxed at regular income rates (higher)
Tax Efficiency: Minimizing tax burden on investments
• Qualified dividends taxed at lower rates
• Tax impact affects net income significantly
• Consider tax implications when selecting stocks
• Hold dividend stocks in tax-advantaged accounts
• Forgetting to account for taxes in calculations
• Not distinguishing between qualified and ordinary dividends
• Underestimating tax impact on returns
Which of the following is the BEST indicator of dividend safety?
The answer is B) Low payout ratio. The payout ratio (dividends per share ÷ earnings per share) indicates what percentage of earnings are paid out as dividends. A low payout ratio (typically under 60%) suggests the company retains sufficient earnings to cover the dividend and has room for growth. A high payout ratio may indicate the dividend is unsustainable.
While high yield, long history, and growth are all attractive dividend characteristics, the payout ratio is the most direct indicator of sustainability. A company paying out 80% or more of its earnings in dividends may struggle to maintain payments during economic downturns. The payout ratio provides insight into the company's financial capacity to continue paying dividends.
Payout Ratio: Dividends ÷ Earnings (measures sustainability)
Dividend Safety: Likelihood of continued dividend payments
Earnings Coverage: Company's ability to fund dividends
• Payout ratio under 60% generally indicates safety
• High yield alone may indicate risk
• Sustainability is more important than yield
• Look for payout ratios under 60%
• Consider dividend history and growth
• Evaluate company fundamentals beyond yield
• Chasing high yields without considering sustainability
• Ignoring payout ratio in dividend analysis
• Assuming dividend history guarantees future payments
Dividend Basics
Percentage of annual dividend relative to stock price.
\(Yield = \frac{Annual\ Dividend}{Stock\ Price} \times 100\)
Measures income generation relative to investment cost.
- Higher yield = More income potential
- Consider sustainability along with yield
- Low payout ratio = Safer dividend
Investment Strategies
Balance current income with dividend growth potential.
- Target 3-5% yield for income
- Focus on dividend growth stocks
- Diversify across sectors
- Consider tax implications
- Company fundamentals matter
- Dividend sustainability is key
- Tax efficiency improves returns
- Reinvestment accelerates growth
FAQ
Q: What's a safe dividend yield?
A: Generally 2-4% is sustainable. Yields above 6% may indicate risk. Focus on payout ratio under 60% for safety.
Q: Dividend vs bond yield?
A: Dividends offer growth potential (4% yield growing 5% annually), bonds provide fixed income (3% yield). Dividend stocks: 4% yield → 5.1% in 5 years. Bonds: Fixed 3%.